Highlights
- Studying CD4+ T cell heterogeneity, plasticity and differentiation by combining modeling and experimentation.
- Building multiscale modeling platforms and models driven by high-performance computing
- Characterizing how innate immune responses modulate adaptive immunity in the context of enteric pathogen infection.
- Developing predictive, validated computational models of immune responses during IBD
- Building a synthetic human mucosal immune system
- CD4+ T cell differentiation
- Mucosal immune responses to H. pylori infection
Ongoing Efforts
Computational modeling uses computer simulation of mathematical models to study the behavior of complex systems. NIMML uses computational models in combination with pre-clinical and clinical immunology experimentation to understand the dynamics of immunological networks leading to the characterization of novel mechanisms of immune modulation.
Computational immunology or immunoinformatics encompasses applying computational modeling, genomics, and bioinformatics approaches to study immunological processes at the systems level. NIMML and MIEP apply abductive reasoning to investigate novel immunological mechanisms and identify unforeseen therapeutic targets in the context of human diseases.
 Cell Designer image: COPASI model of CD4+ T cell differentiation
Highlights
- NIMML is studying CD4+ T cell heterogeneity, plasticity and differentiation by using mathematical and computational modeling in combination with immunology experimentation.
- Our predictive, validated model simulates the differentiation of 4 different phenotypes: T helper 1 (Th1), Th2, Th17, and Treg and has helped us to identify novel therapeutic targets
- NIMML is currently developing a multiscale model that integrates CD4+ T cell differentiation and plasticity across scales.
- NIMML is investigating the differential metabolic and signaling requirements of Th1 versus follicular T helper Cells (Tfh) in an environment with high and low IL-2.
Ongoing Efforts
The population of CD4+ T cells is functionally and phenotypically heterogeneous consisting of at least four subsets involved in coordinating various aspects of adaptive immunity. Upon antigenic stimulation by antigen-presenting cells, naïve CD4+ T cells (Th0) expand and differentiate into at least three effector cell subsets referred to as Th1, Th2, Th17, and induced regulatory T (iTreg) cells (Figure 1). In addition to the four Th phenotypes studied and modeled in this project other CD4+ T cell phenotypes have been characterized, including transforming growing factor β (TGF-β)-producing CD4+ T cells (Th3), IL-10-producing CD4+ T cells (Tr1), IL-9-producing CD4+ T cells (Th9) and T follicular helper (Tfh) cells located in the follicular regions of lymph nodes and spleen. Signaling pathways controlling fates on these phenotypes are closely connected to the four core subsets (Th1, Th2, Th17 and iTreg) (Figure 2). Each of these phenotypes is characterized by distinct effector and regulatory functions, which are regulated by a signature pattern of cytokines and multiple transcription factors. The signaling pathways that lead to these four predominant fates are cross-regulated via feedback loops that facilitate a balanced immune response to pathogens or abnormal cells while avoiding chronic inflammation and autoimmunity.
CD4+ T Cell Model
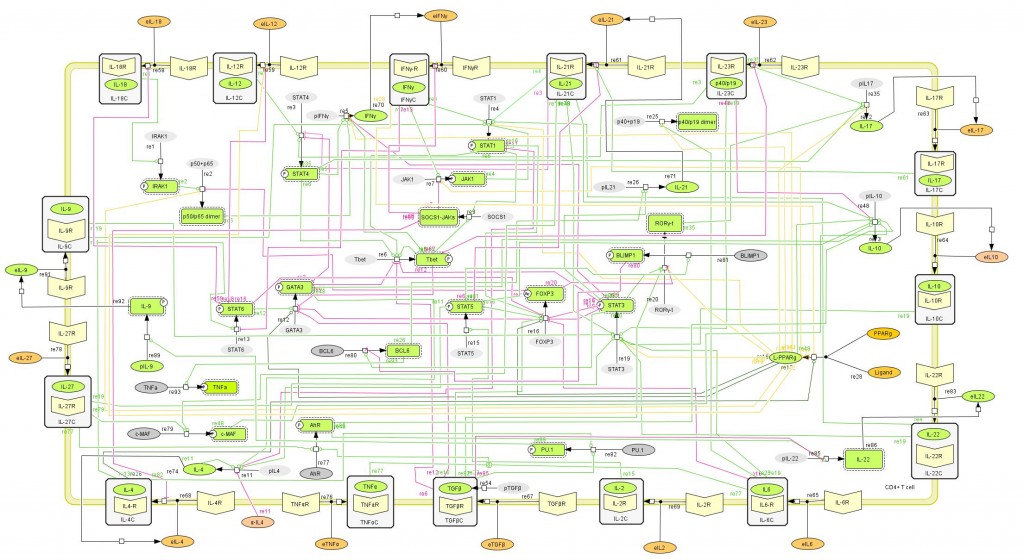
The signaling network illustrates network topologies associated with differentiation towards T helper (Th)1 (red shadow), Th2 (green shadow), Th17 (blue shadow) and induced regulatory T cells (iTreg, yellow shadow). The network is provided in Systems Biology Markup Language-compliant format. We present for the first time a mathematical and computational model built upon the current paradigms of molecular interactions that occur in CD4+ T cells. This model will help us to elucidate the regulatory mechanisms underlying CD4+ T cell differentiation, identify novel putative CD4+ T cell subsets, and study the dynamics of Th cell differentiation. This is a first step toward a more comprehensive understanding of the dynamics of the CD4+ T cell differentiation process at the systems level. Thus, we are describing activation pathways by phenotype, as well as the inhibitory mechanisms that lead to the induction or suppression of a CD4+ T cell phenotype. Generating a mathematical model usually is comprised of three steps: first, a translation from the literature into a structural network is needed. The architecture of the model has to be assembled based on literature fates. Secondly, data extracted from the literature and data generated by our laboratory is inserted in the model to adjust the dynamics of the model and ensure the correct trends and behaviors of different molecules in the model. This process is known as ‘parameter estimation’. Once the parameters are set, a quality control check is needed to guarantee that signaling pathways are being activated promptly at the correct time with the right signal. At this point, the model is ready to start running in silico experimentation and generating predictions with the right initializations. Ultimately, computational results will be generated, in vitro and in vivo validation studies are performed and the data generated in those studies is used to re-calibrate the model, using ‘parameter estimation’ again, thus closing and completing the modeling process. Once all the relationships between molecules were set, they were incorporated in the CellDesigner diagram representing a single CD4+ T cell. This diagram represents the cellular response of one CD4+ T cell activating and inhibiting reaction that take place in three different places: the extracellular environment, the cytoplasm and the nucleus space. To model CD4+ T cell differentiation, hill function and mass action equations were used. While Hill Coefficient allowed us to quantify the effect of a ligand binding a macromolecule through cooperative binding, mass action laws can represent dynamic equilibriums for elementary reactions, considering products as a proportion of the participating molecules in the reaction. An example can be found below:
The parameter estimation computational approach was used to determine the unknown constants driving the dynamics of the model. Briefly, we used the Particle Swarm Optimization (PSO) algorithm to obtain computational values for our model parameters in order to fit our experimental data to the model. PSO is a global search algorithm and thus depends only minimally on the initial guess of each parameter and therefore avoids the subjective estimation caused by initial guesses in local methods as Levenberg-Marquardt. The results on the parameter estimation using Particle Swarm shows a good fitting between the experimental data and the values computationally estimated by COPASI with reduced weighted error (Table 1 and Figure 3). Moreover, we could estimate the parameters for the complete model with the parameter estimation task (Table 2).
A species is fitted computationally using experimental data and simulation algorithms. The objective value is the value that COPASI targets based on the experimental data and the computational simulation.
IL-17 and FOXP3 were fitted by COPASI using the ParticleSwarm algorithm. The fitted value (dark blue and pink dots) could reproduce the behavior of the measured value (red and light blue dots). The weighted error (green dots) is around 0, indicating that the fitting has been performed successfully. Once this step is completed, quality control is performed. Using the proper initialization given by literature, the system is induced to the four phenotypes and checked to reproduce the correct up- and downregulation of specific molecules. These four phenotype checks are the result of our CD4+ T cell modeling efforts after calibration and they provide evidence that our computational and mathematical model is capable of reproducing the behaviors of the four CD4+ T cell phenotypes in terms of cytokines, inductors and transcription. In addition, we demonstrate that the calibration process has been run successfully and the dynamics of the CD4+ T cell differentiation network model are adjusted to mimic immunological behaviors characteristic of each phenotype (Figure 4).
- A fitted specie is fitted computationally using experimental data and simulation algorithms
- The objective value is the value that COPASI targets based on the experimental data and the computational simulation
The addition of increasing amounts of IL-12, IL-18 and IFN-γ (Th1), IL-4 (Th2), IL-6 and TGF-β (Th17) or TGF-β alone (iTreg) as external stimuli in the system resulted in increasing amounts of related molecules for each phenotype. After passing quality control, the CD4+ T cell computational model was able to predict different trends summarized in Table 3.
The CD4+ T cell differentiation model predicted behaviors 1-4 at a post-calibration stage. These predictions are the results of in silico experimentation using scans, time-courses and loss-of-function approaches. The CD4+ T cell differentiation model is available in BioModels.net here and on our website. This model has been curated by Biomodels.net and the ODEs are also available in SBML format through biomodels.net This modeling work was initiated in January 2009, using a logical model for CD4+ T cell differentiation. Using the ODE-based approach, the model has evolved dramatically. The following is a list of archived CD4+ T cell model releases. Please click on individual releases for more details. The ordinary differential equations set can be found here. The following is a list of archived CD4+ T cell model releases. Please click on individual releases for more details.
The primary MIEP Team member responsible for maintaining this model is Adria Carbo at the Virginia Bioinformatics Institute. Please contact Adria with any questions or comments. For the latest release, The model is available for download in CellDesigner xml format. We have tested that the model is compatible with Cell Designer 4.3.
- Eighth, the latest, release on Feburary 5th, 2014
- Seventh, release on October 10th, 2012
- Sixth release on August 3rd, 2012
- Fifth release on April 21st, 2012
- Fourth release on Jan 14th, 2012
- Third release on September 7th, 2011
- Second release on June 7th, 2011
- First release on March 27th, 2011
Data Figures
-
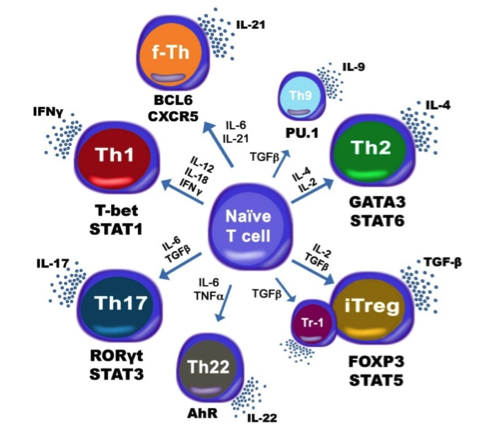 Figure 1. Schematic representation of the cytokines and transcription factors controlling CD4+ T cell differentiation.
-
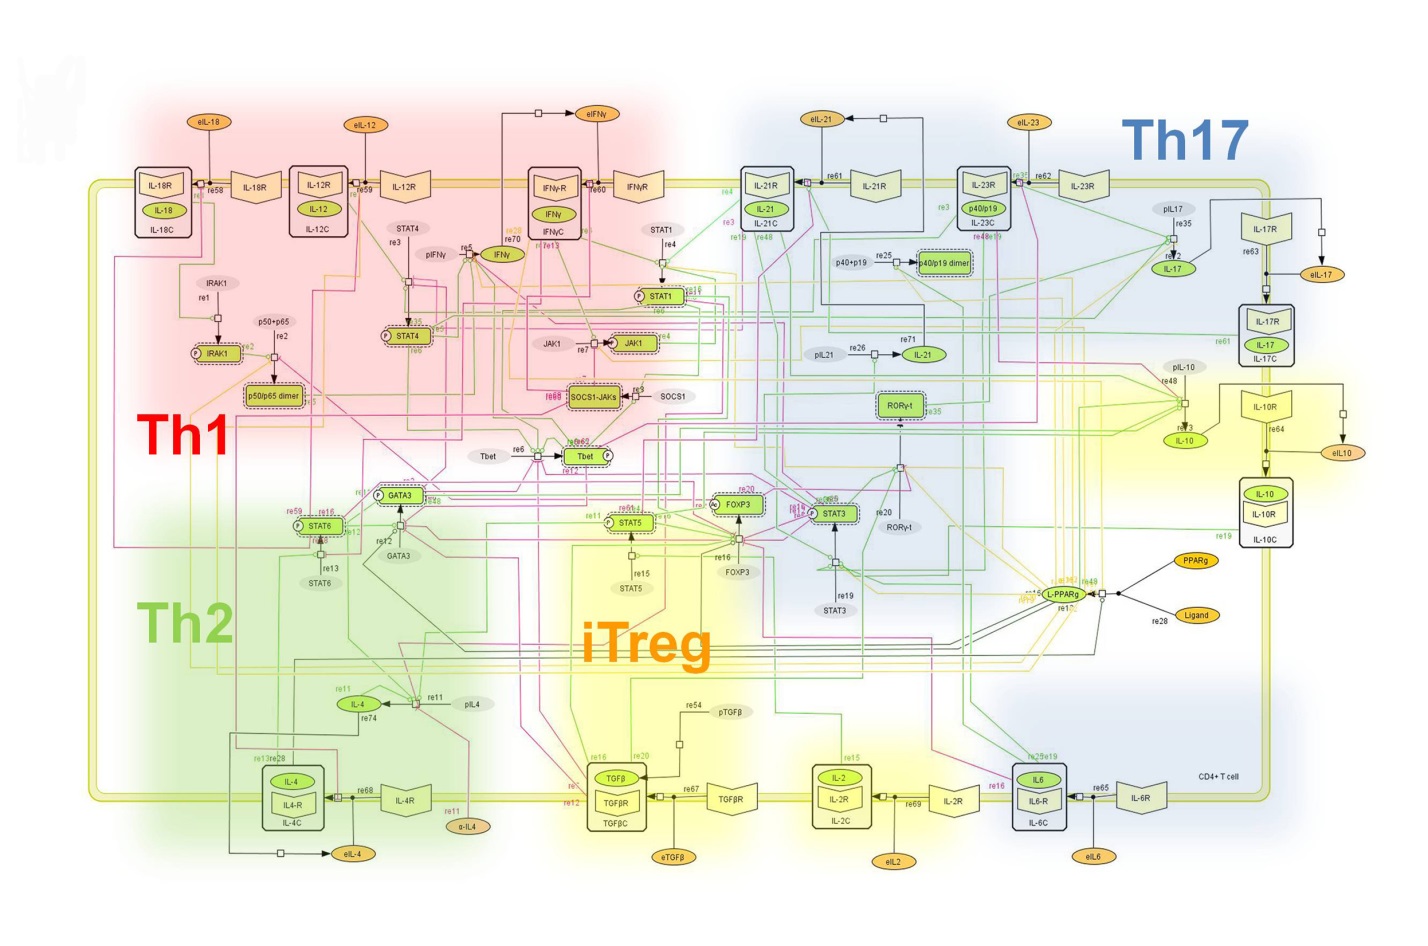 Figure 2. Network model illustrating the complex intracellular signaling pathways and transcriptional factors controlling the CD4+ T cell differentiation process.
-
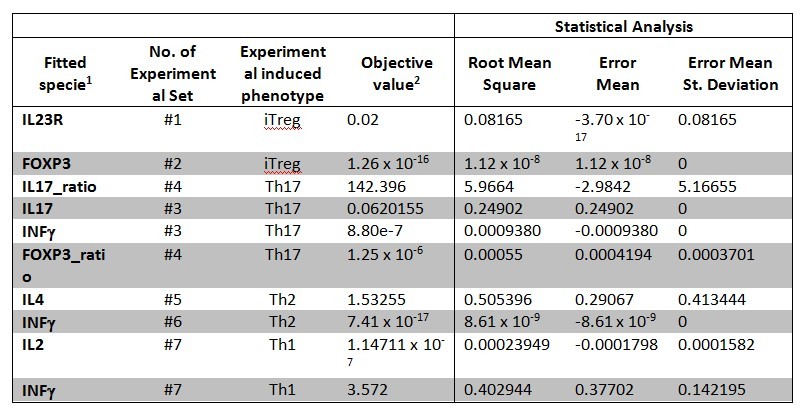 Table 1. CD4+ T cell model fitting performed by using COPASI’s global parameter estimation.
-
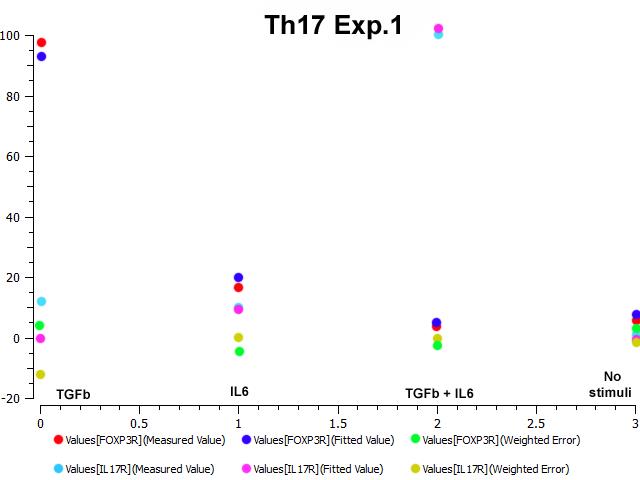 Figure 3. Parameter estimation results for the Th17 phenotype.
-
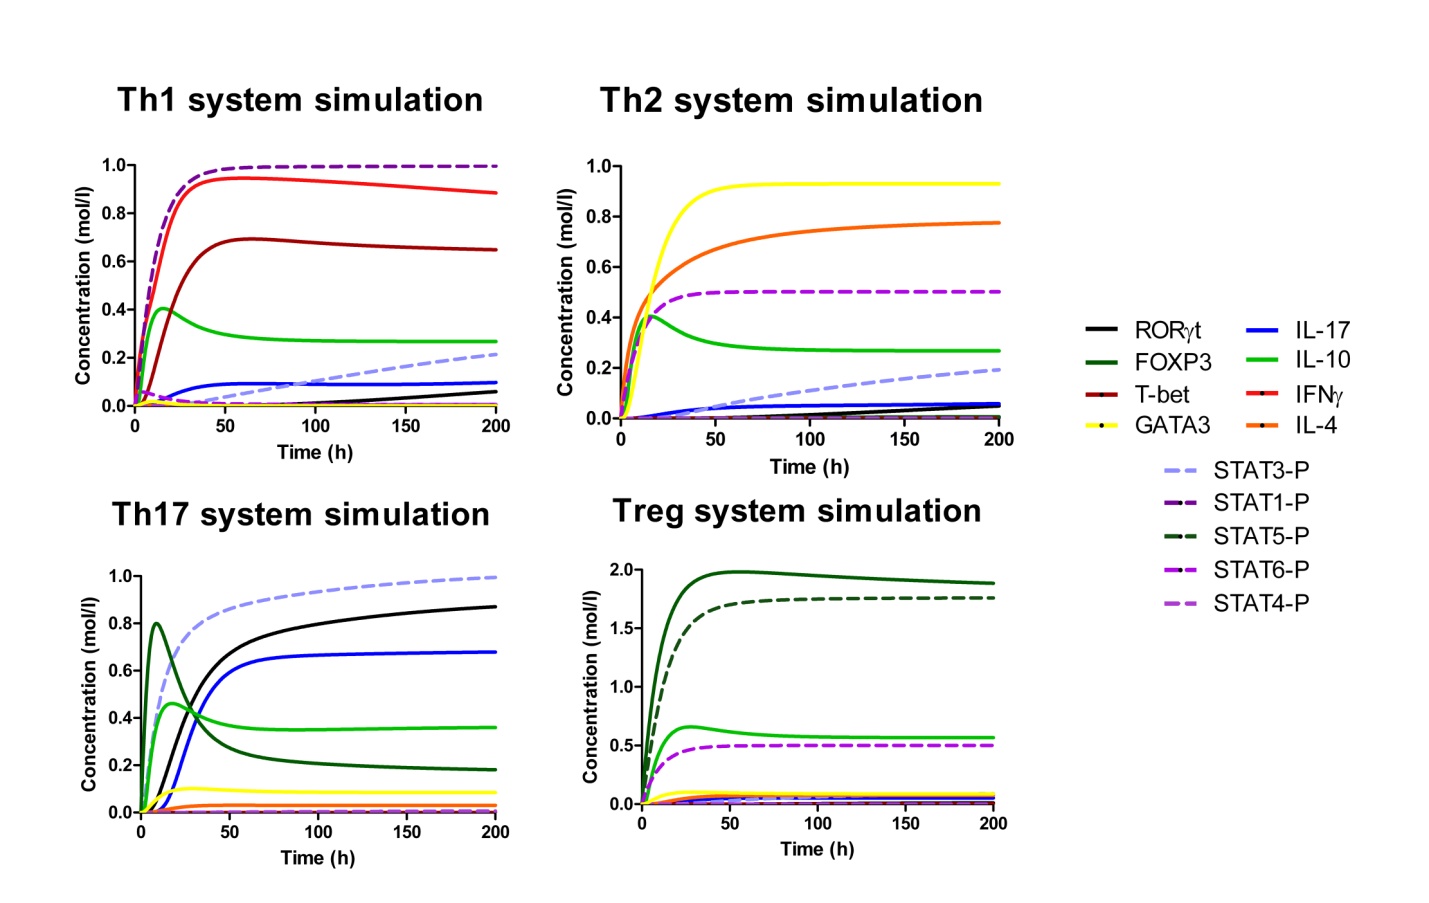 Figure 4. Induction of effector T helper type 1 (Th1), type 2 (Th2), type 17 (Th17) and induced regulatory T cell (iTreg) phenotype differentiation in silico.
-
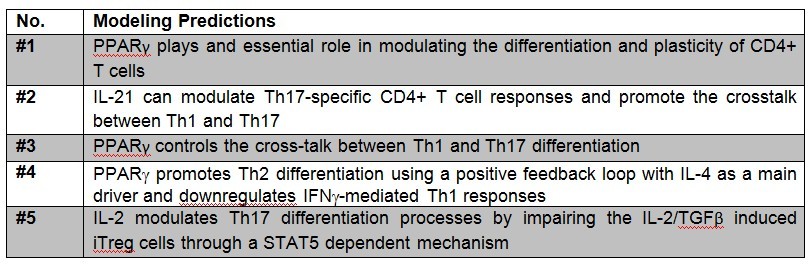 Table 3. Table of predictions derived from the CD4+ T cell computational model.
-
 Figure 5. CD4+ T-cell multiscalability
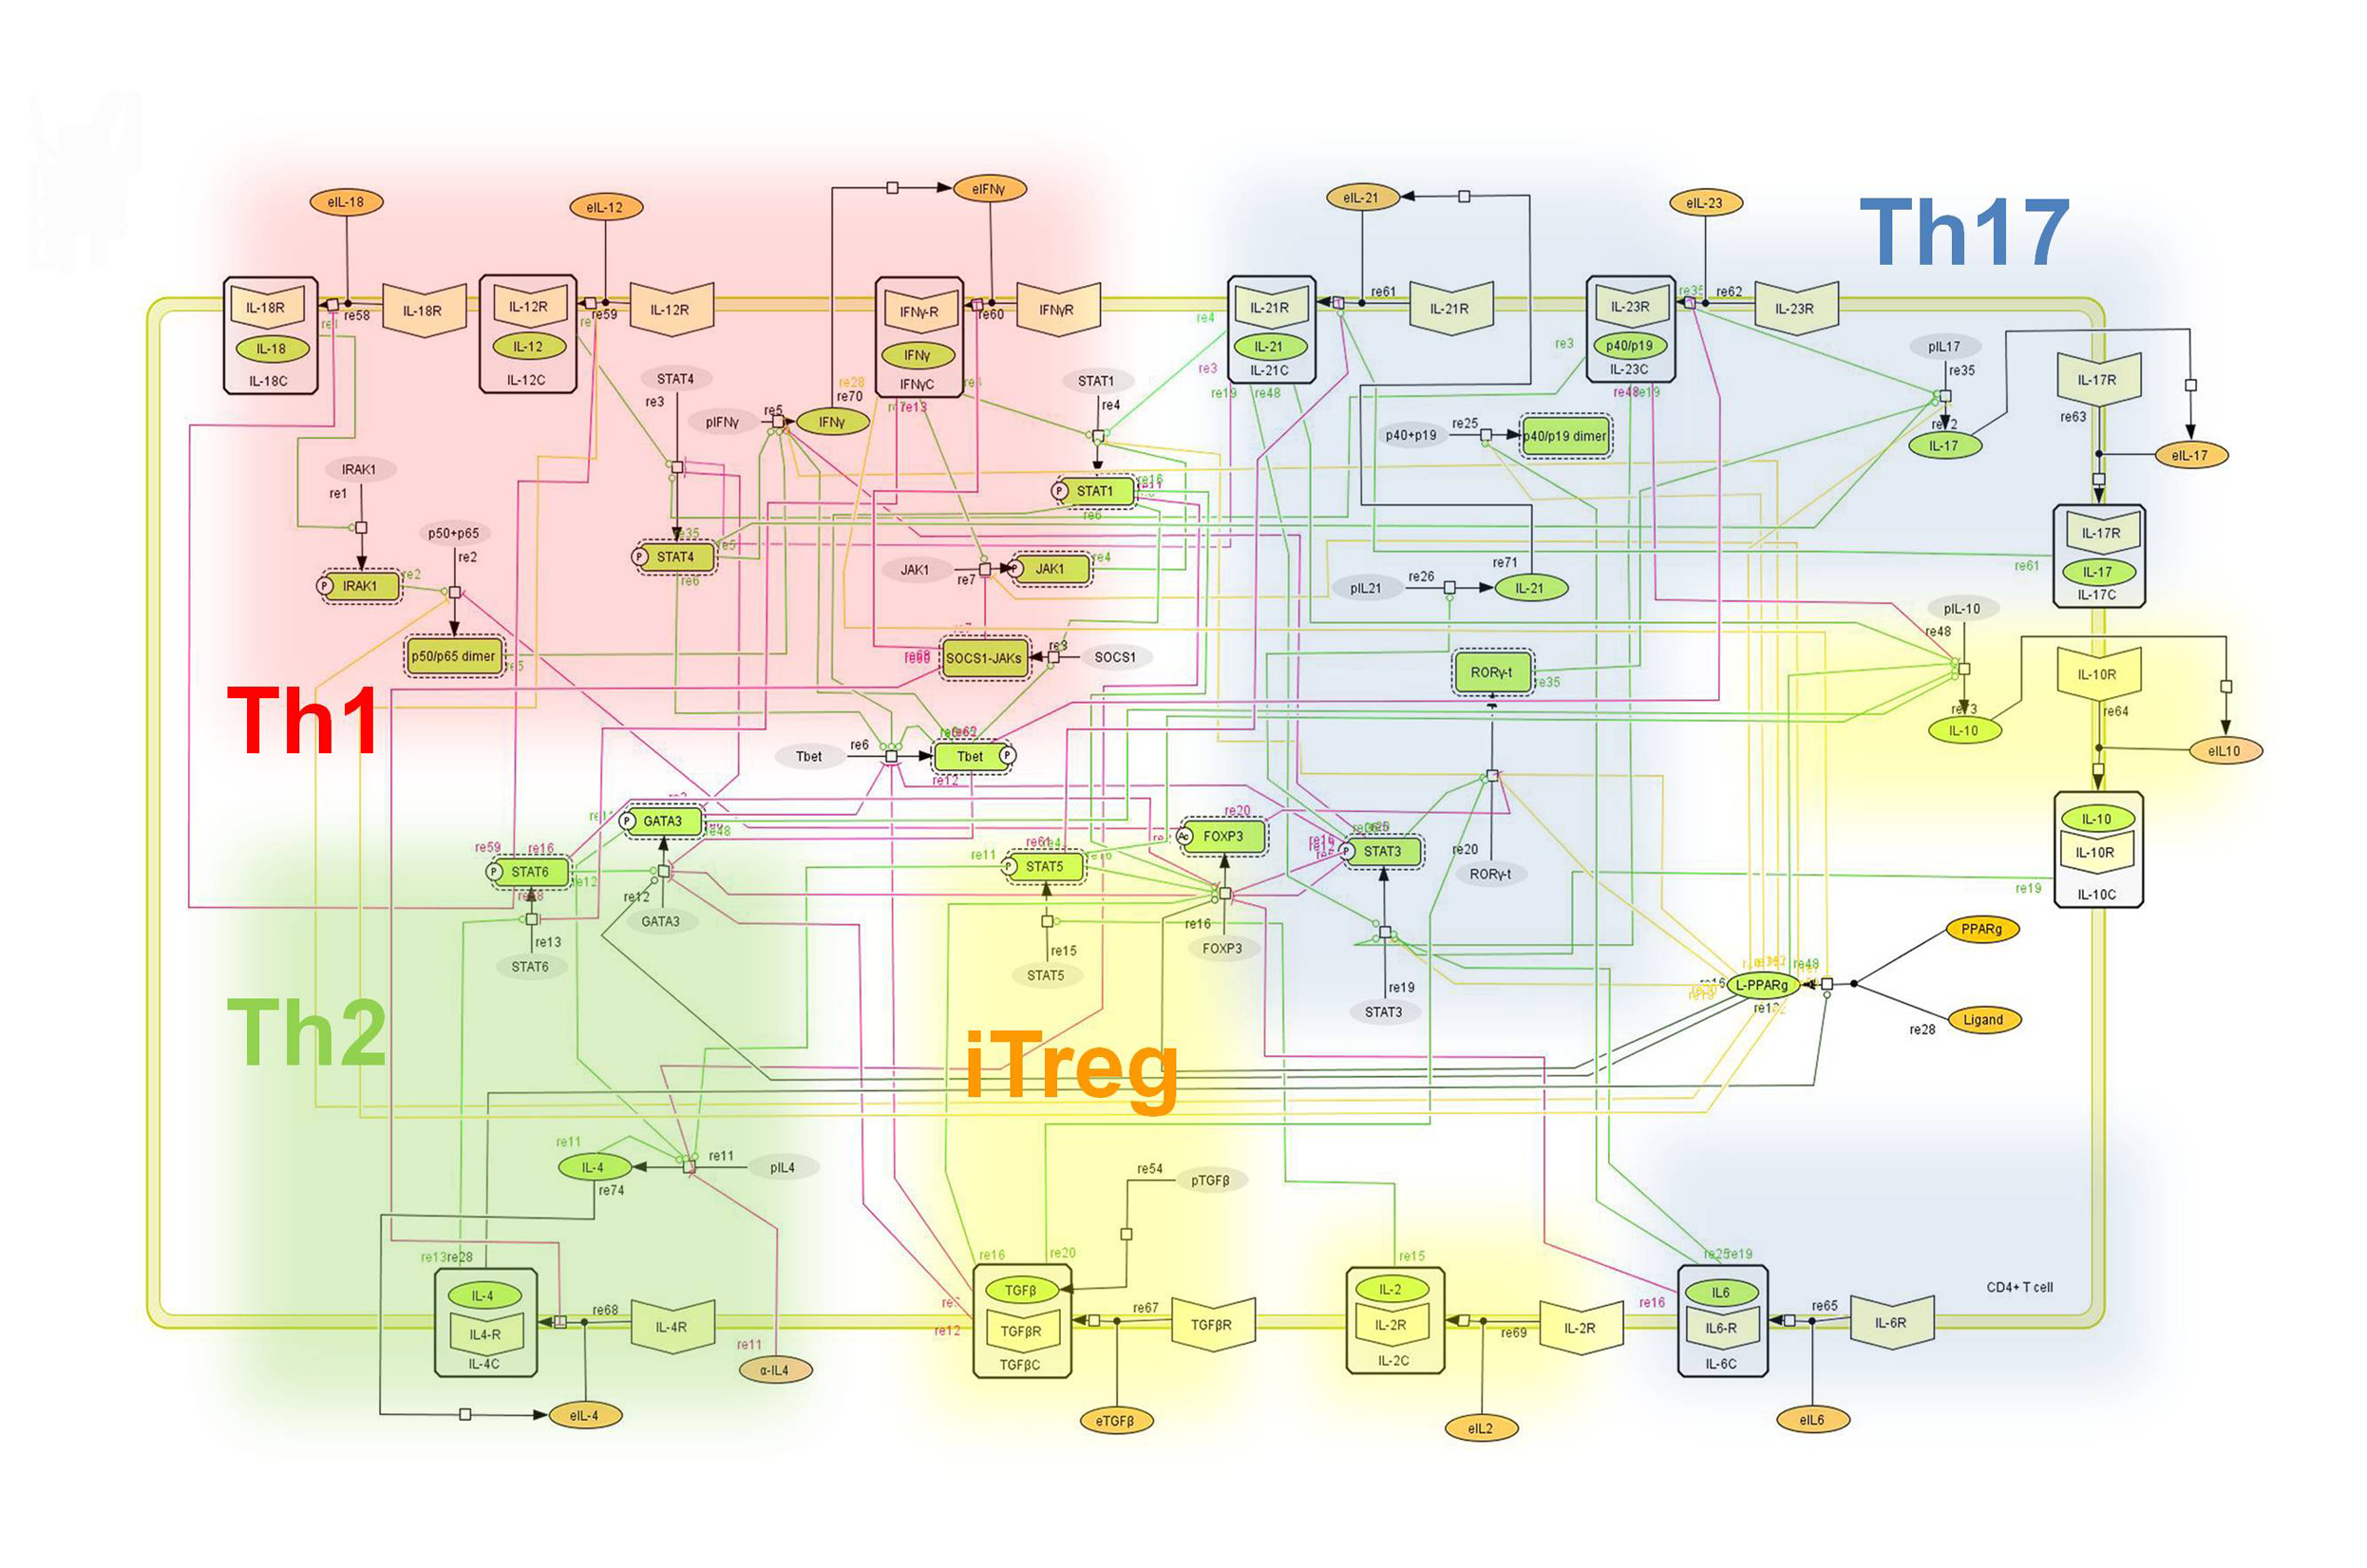 Figure 1. Network model illustrating the complex intracellular signaling pathways and transcriptional factors controlling the CD4+ T cell differentiation process.
Highlights
- PPARγ regulates differentiation, activation and cytokine production, thereby controlling the induction of effector and regulatory responses, and is a promising therapeutic target for dysregulated immune responses and inflammation.
- Our modeling efforts predict that following PPARγ activation, Th17 cells undergo phenotype switch and become iTreg cells.
- This prediction was validated by results of adoptive transfer studies showing an increase of colonic iTreg and a decrease of Th17 cells in the gut mucosa of mice with colitis following pharmacological activation of PPARγ.
- Deletion of PPARγ in CD4+ T cells impaired mucosal iTreg and enhanced colitogenic Th17 responses in mice with CD4+ T cell-induced colitis.
- For the first time we provide novel molecular evidence in vivo demonstrating that PPARγ in addition to regulating CD4+ T cell differentiation also plays a major role controlling Th17 and iTreg plasticity in the gut mucosa.
Abstract
Differentiation of CD4+ T cells into effector or regulatory phenotypes is tightly controlled by the cytokine milieu, complex intracellular signaling networks and numerous transcriptional regulators. We combined experimental approaches and computational modeling to investigate the mechanisms controlling differentiation and plasticity of CD4+ T cells in the gut of mice. Our computational model encompasses the major intracellular pathways involved in CD4+ T cell differentiation into T helper 1 (Th1), Th2, Th17 and induced regulatory T cells (iTreg). Our modeling efforts predicted a critical role for peroxisome proliferator-activated receptor gamma (PPARγ) in modulating plasticity between Th17 and iTreg cells. PPARγ regulates differentiation, activation and cytokine production, thereby controlling the induction of effector and regulatory responses, and is a promising therapeutic target for dysregulated immune responses and inflammation. Our modeling efforts predict that following PPARγ activation, Th17 cells undergo phenotype switch and become iTreg cells. This prediction was validated by results of adoptive transfer studies showing an increase of colonic iTreg and a decrease of Th17 cells in the gut mucosa of mice with colitis following pharmacological activation of PPARγ. Deletion of PPARγ in CD4+ T cells impaired mucosal iTreg and enhanced colitogenic Th17 responses in mice with CD4+ T cell-induced colitis. Thus, for the first time we provide novel molecular evidence in vivo demonstrating that PPARγ in addition to regulating CD4+ T cell differentiation also plays a major role controlling Th17 and iTreg plasticity in the gut mucosa.
Summary
To facilitate a comprehensive representation of the dynamics associated with the major pathways activated by cytokines which control CD4+ T cell differentiation and plasticity, we constructed an ordinary differential equation (ODE)-based computational model including cytokines, membrane receptors and transcription factors (Figure 1).
The signaling network illustrates network topologies associated with differentiation towards T helper (Th)1 (red shadow), Th2 (green shadow), Th17 (blue shadow) and induced regulatory T cells (iTreg, yellow shadow). The network is provided in Systems Biology Markup Language-compliant format.
Thus, we combined computational modeling and mouse adoptive transfer studies to gain a better mechanistic understanding of the modulation of CD4+ T cell differentiation and plasticity at the intestinal mucosa of mice. Our sensitivity analyses highlighted the importance of PPARγ in the regulation of Th17 to iTreg plasticity. Indeed, in vivo evidence demonstrates that PPARγ is required for the plasticity of Th17 promoting a functional shift towards an iTreg phenotype.
More specifically, the loss of PPARγ in silico caused upregulation of RORγt and IL-17 in Th17 cells (Figure 2B) and down-regulation of FOXP3 in iTreg cells (Figure 2D) compared to wild-type CD4+ T cells (Figure 2A and 2C). These results demonstrate that PPARγ exerts a regulatory role in CD4+ T cell differentiation from a naïve state to Th17 or iTreg cells. The transfer of CD4+ T cells lacking PPARγ in vivo resulted in significantly greater accumulation of IL-17-producing Th17 cells and lower levels of FOXP3+ iTreg cells in spleen, MLN and colonic LP of recipient mice (Figure 2E and 2F).
(A-D) Computational simulation of the effect of PPARγ deficiency on differentiation from a naïve state into either Th17 or iTreg phenotypes. (E) Th17 cell accumulation in spleens of recipients of wild-type versus PPARγ null CD4+ T cells. (F) Treg cell accumulation in spleen, mesenteric lymph nodes (MLN) and lamina propria (LP) of SCID recipient mice.
Furthermore, computational results show that following induction of Th17 and subsequent PPARγ activation, IL-17, STAT-3 and RORγt were dramatically downregulated, whereas FOXP3 was upregulated, thereby demonstrating a phenotypic switch from a Th17 to an iTreg phenotype (Figure 3A). To ensure that parameter space scan and time-course were linked and the changes in PPARγ were being observed in a time-dependent manner, a combination of both was run, reiterating the phenotype switch with increasing concentrations of PPARγ over time observing an upregulation of FOXP3 and a downregulation of IL-17, RORgt and STAT3-P (Figure 3B). To address this hypothesis, naïve CD4+ T cells were transferred in vivo into RAG2-/- recipients. When clinical signs of disease and colitis appeared, a subset of mice was sacrificed and spleen, MLN and colons were extracted to examine Th17 and Treg levels (baseline results). After verifying the presence of Th17 cells in colon, MLN and spleen, half of the mice were received a daily treatment of 70 mg/kg of pioglitazone given orally to activate PPARγ (Figure 3C). Histopathological examinations also showed that colons from recipient mice treated with pioglitazone had a significantly lower lymphocytic infiltration and crypt hyperplasia than those from non-treated recipients. Untreated mice maintained a predominant Th17 response characterized by increased levels of CD4+ T cells expressing RORγt and IL-17A. In contrast, pioglitazone-treated mice not only recovered from colitis and its associated weight loss, but also showed a switch from a predominant Th17 into an iTreg phenotype characterized by increased expression of FOXP3 and decreased IL17-A and RORγt in CD4+ T cells of the colonic LP and MLN (Figure 3D and 3E). This data supports the in silico prediction that activation of PPARγ in Th17 cells favors differentiation into iTreg cells, which facilitates colonic tissue reconstitution and recovery from disease.
(A) Computer simulation illustrating a down-modulation of IL-17, STAT3, RORγt and upregulation of FOXP3 in a differentiated Th17 cell following PPARγ activation. (B) Combination of time-course and PPARγ concentration scan to assess changes of IL-17, STAT3, RORγt and FOXP3 over time. (C) Experimental design for the validation of the model prediction. (D-E) Accumulation of iTreg and Th17 cells in the mesenteric lymph nodes (MLN) and colonic lamina propria (LP) of recipient mice.
In summary, we demonstrate for the first time that activation of PPARγ results in reprogramming of the CD4+ T cell molecular pathways that control the Th17 phenotype, leading to the induction of an iTreg phenotype. This phenotype switch is associated with protection from CD4+ T cell-induced colitis during adoptive transfer experiments in mice. Thus, the balance between Th17 and Treg cells helps delineate the outcome of immunological processes from effector inflammation to regulatory tolerance. Our modeling approaches allowed us to narrow the design of experiments and to better understand the molecular mechanisms of action controlling CD4+ differentiation. This new mechanistic knowledge is broadly applicable to the development of immune therapeutics for infectious, allergic and immune-mediated diseases. More specifically, we propose that PPARγ is a promising therapeutic target for chronic inflammatory and infectious diseases where Th17 cells contribute to the gut immunopathogenesis.
Data Figures
-
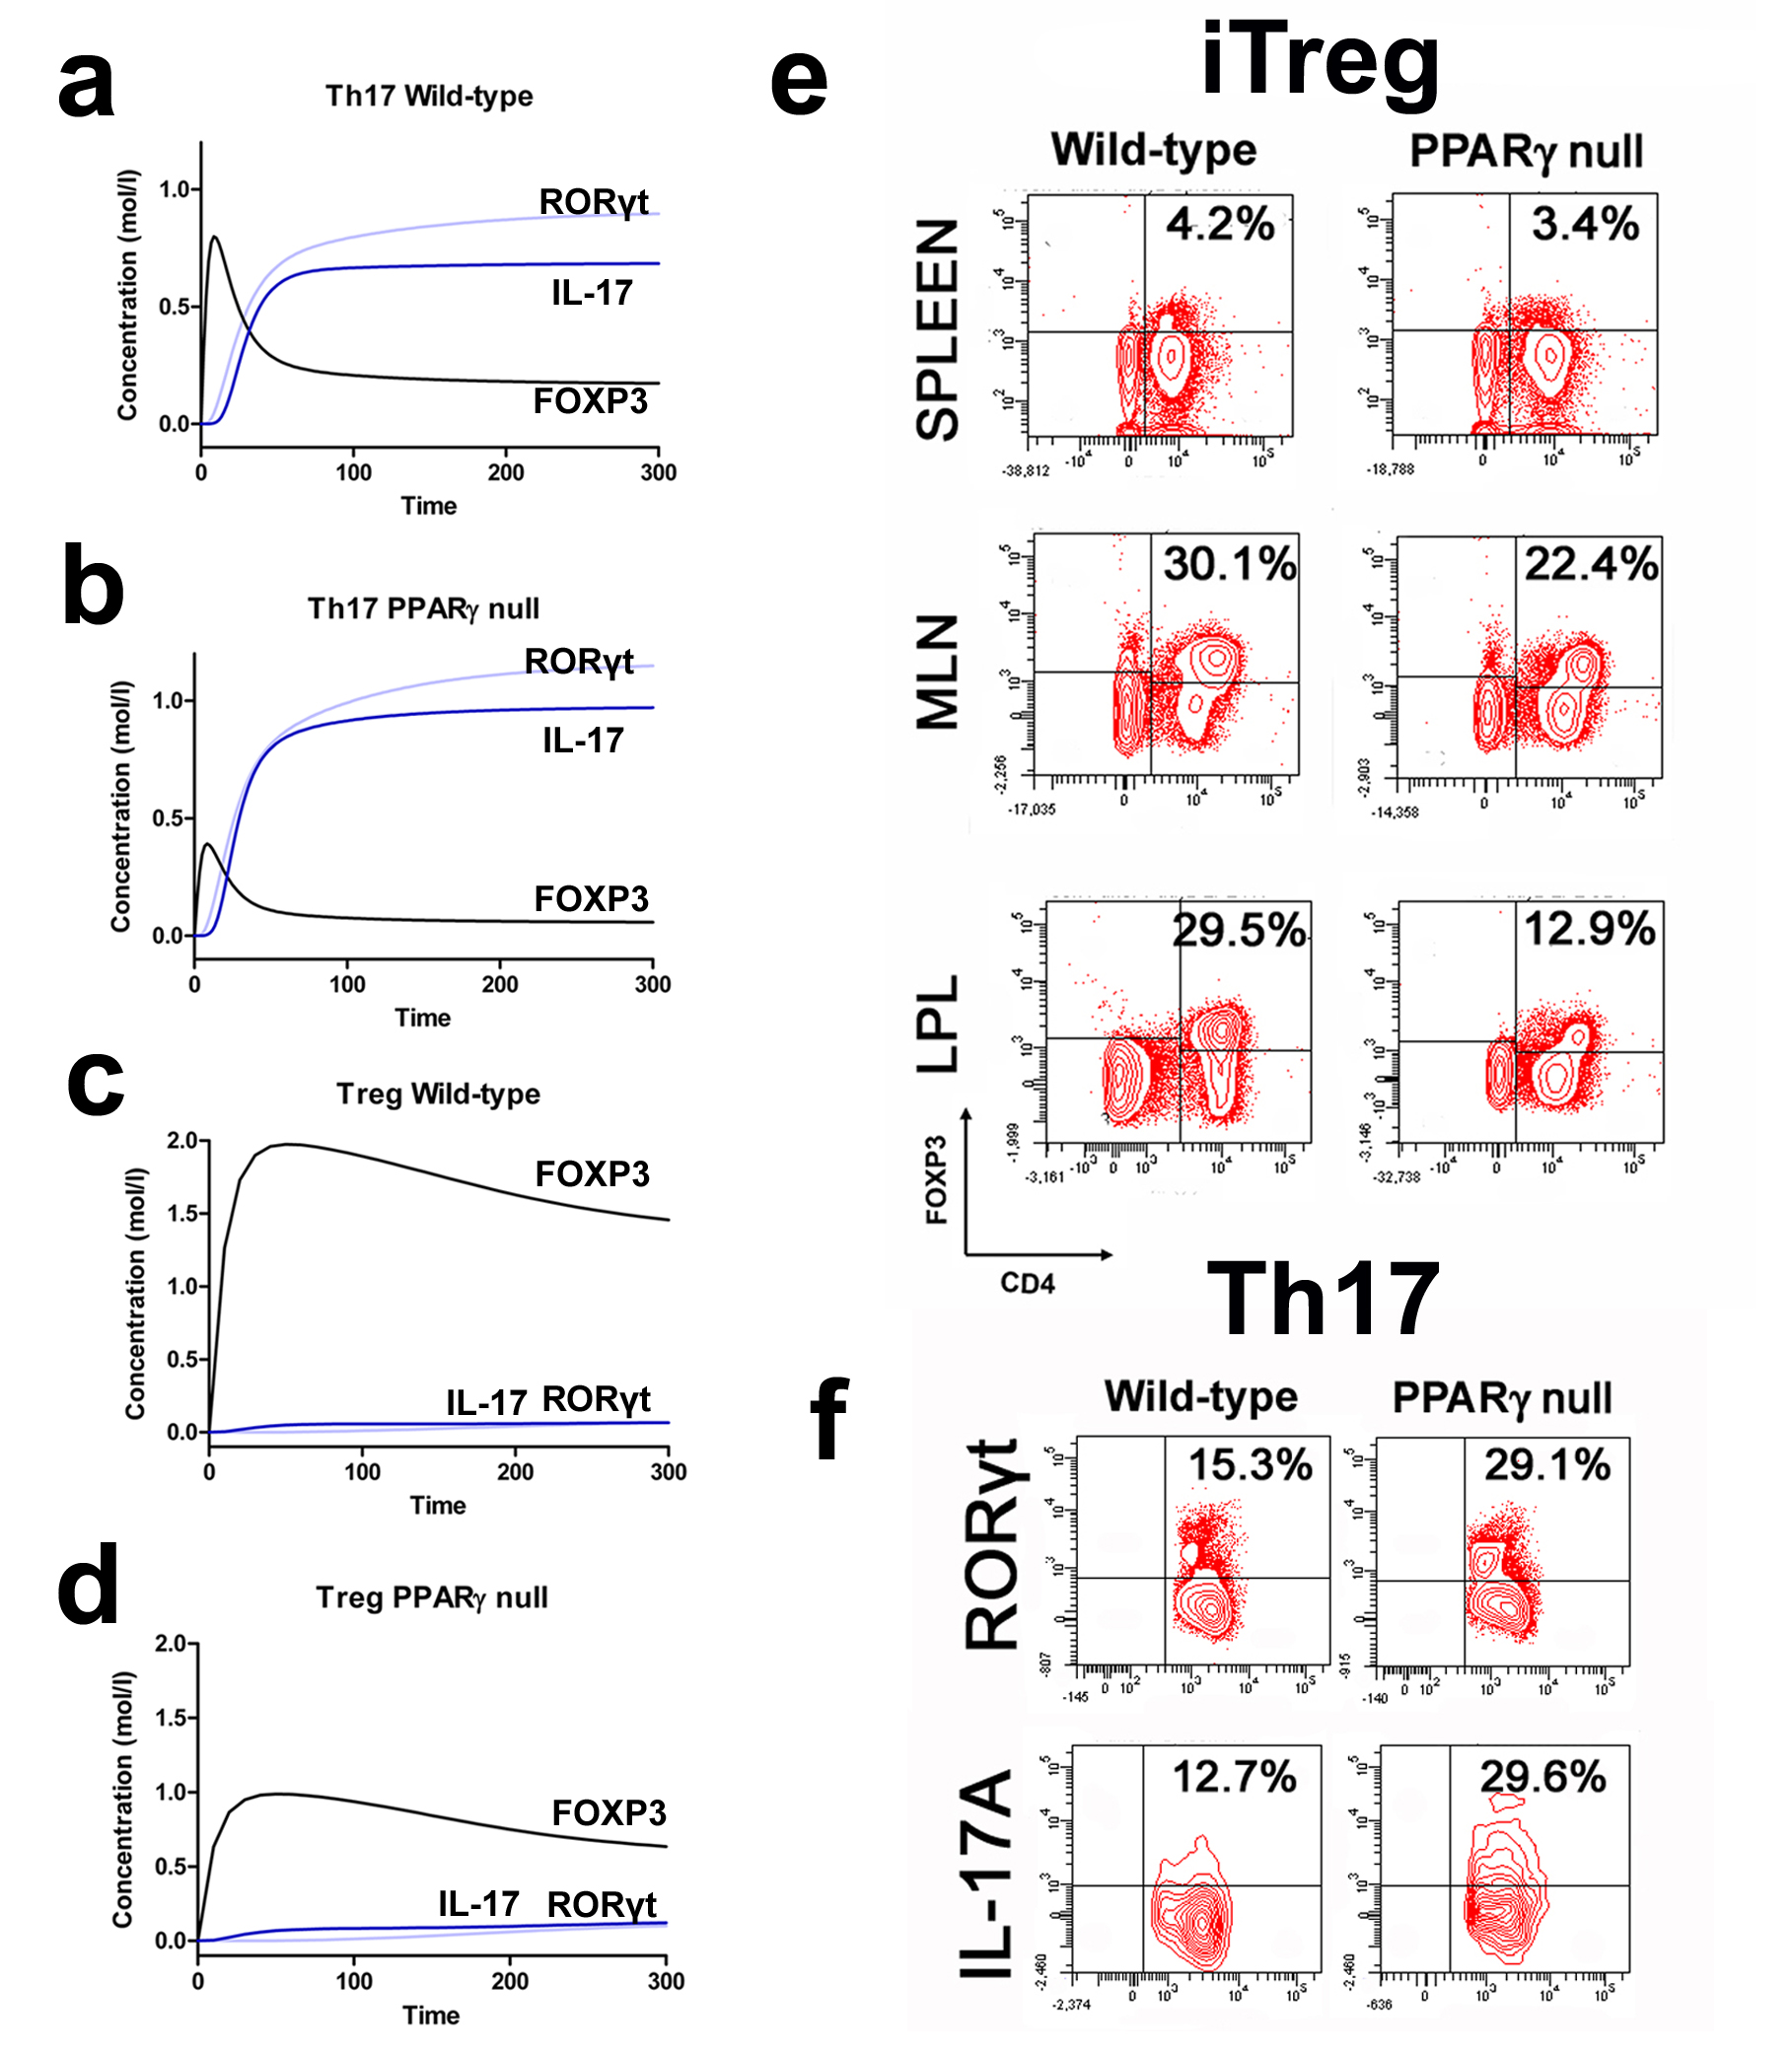 Figure 2. Peroxisome proliferator-activated receptor (PPAR) γ suppresses T helper (Th)17 cell differentiation and upregulates FOXP3 expression in vivo.
-
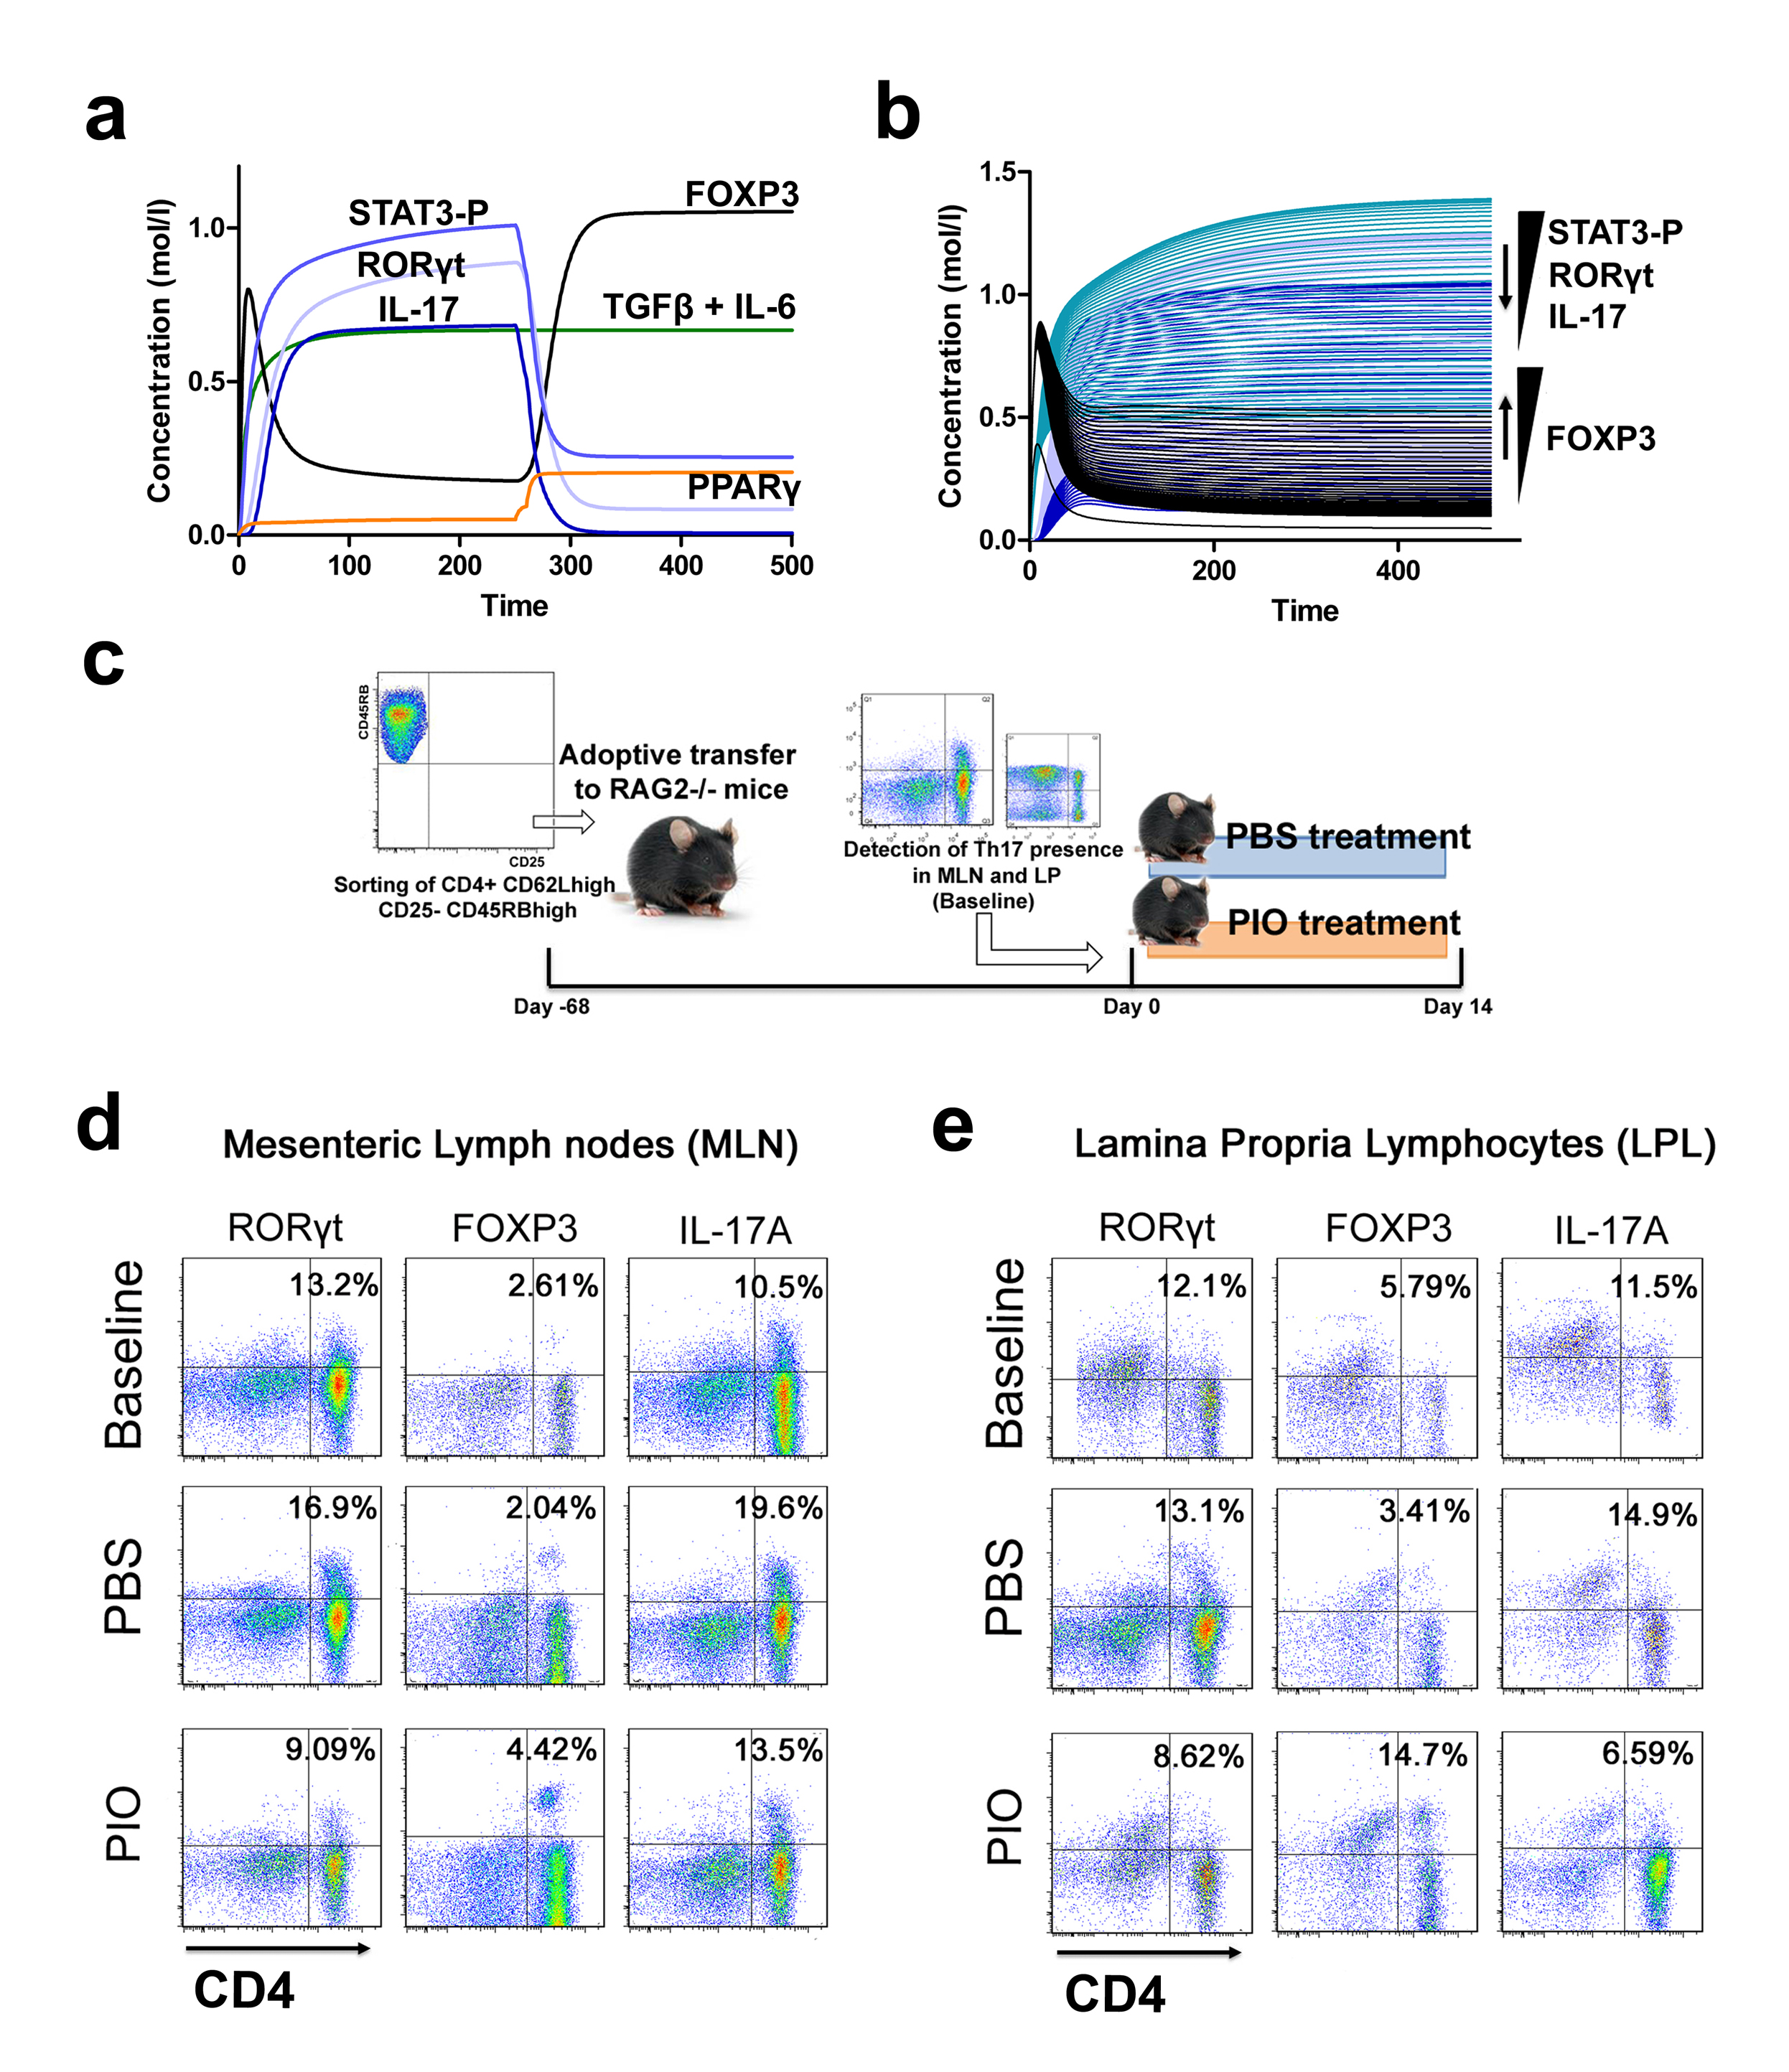 Figure 3. Validation of the modeling prediction regarding the role of peroxisome proliferator-activated receptor (PPAR) γ in regulating the plasticity between T helper (Th) 17 and induced regulatory T cells (iTreg).
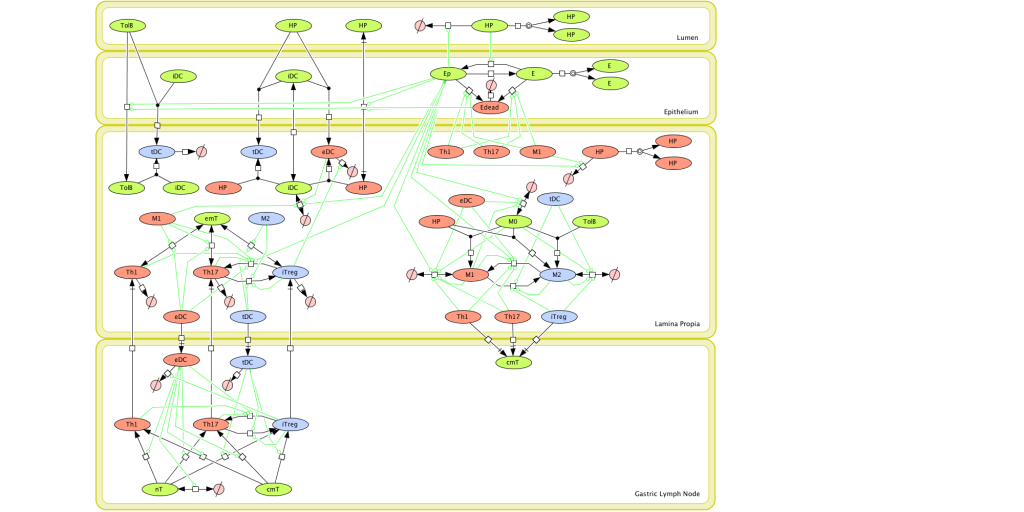 Figure 1. Computational model of the mucosal immune responses to Helicobacter pylori.
Highlights
- NIMML built a mathematical and computational model describing the immune response towards Helicobacter pylori infection.
- NIMML used two different strategies to model these reactions: ODE-based modeling and ABM-based modeling.
- Both strategies resulted in similar results, proving that the combination of ODE and ABM, when used as a complementary approach, can result in the identification of crucial nodes and in the generation of novel hypotheses.
Modeling of immune responses towards H. pylori - Ordinary differential equation model
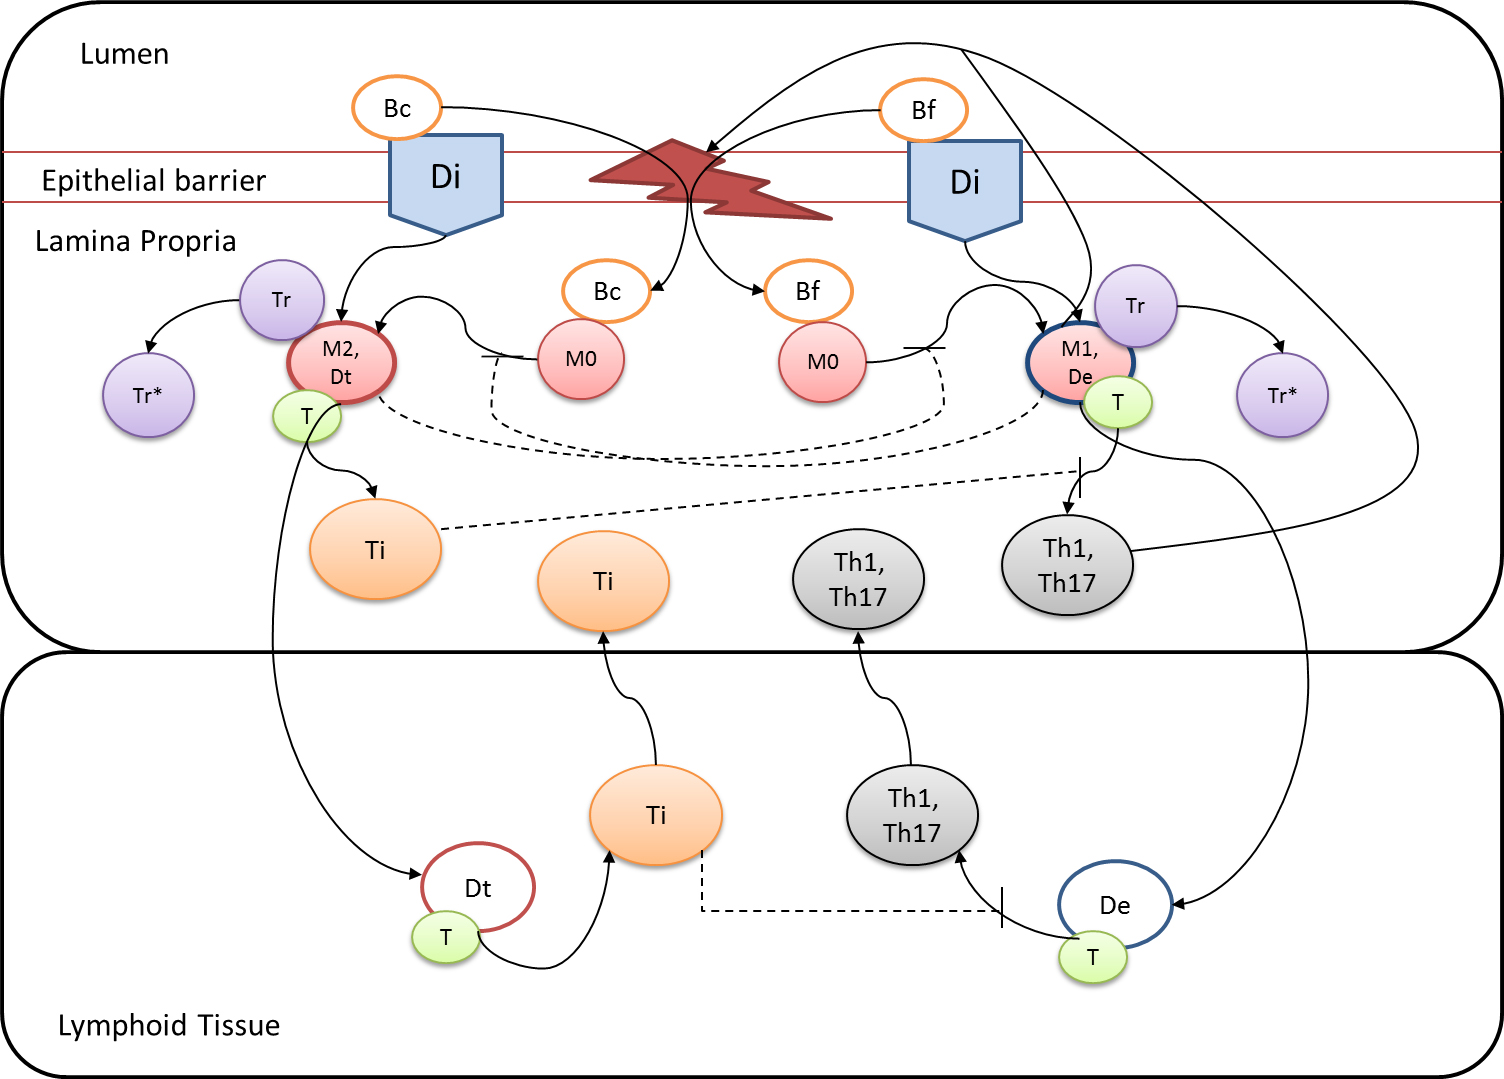
Given the complexity of the host-H. pylori interaction and to facilitate a better understanding of the gastric mucosal immune response during H. pylori infection, we constructed a computational and mathematical model (Figure 1). The structural network of the model is comprised of three different compartments representing the effector sites: the gastric lumen, the epithelium and the gastric lamina propria plus a fourth inductor compartment representing the gastric lymph nodes (GLN). This network was used for equation-based and agent-based modeling efforts. The equation-based model is comprised by 24 species and 26 ordinary differential equations (ODE) that drive 43 reactions in both gastric mucosa and GLN, and encompasses both inflammatory and regulatory pathways.
Helicobacter Pylori Model
Our computational simulations using ODE modeling show a distinct time-dependent behavior in the three CD4+ T cell phenotypes (i.e., Th1, Th17 and iTreg) represented in the model during H. pylori infection. Whereas Th17 is crucial at an early stage of the infection, Th1 predominates over Th17 and is key for the chronicity of the infection in the gastric LP. Together with these responses, there is a regulatory T cell upregulation peaking at day 30 and being persistent over the infection. Experimentaly, stomachs of H. pylori infected mice have more histopathological lesions(Figure 3F, 3G) To determine and track the main responsible subsets triggering such lesions, sensitivity analysis (SA) methods were applied. Results showed how at the early stage of infection, the epithelial cell damage is mainly caused by the bacterium itself (Figure 2A). Interestingly, as the infection progresses, a trend towards Th1 cells triggering epithelial cell damage (Figure 2B) is observed. At the chronic phase of the infection, results showed a dramatic increase of Th1- and Th17-inducing epithelial cell damage (Figure 2C). Of note, SA performed in the deterministic model at day 60 post infection also showed how Th1 and Th17 in both LP and GLN were contributing to the formation and accumulation of damaged epithelial cells as well as M1 macrophage differentiation, whereas H. pylori exhibited no impact on such formation (Figure 8D).
The following is a list of archived COPASI Helicobacter Pylori computational model releases. Please click on individual releases for more details.
The primary MIEP team members responsible for maintaining this model are Adria Carbo, Mireia Pedragosa and Kate Wendelsdorf at the Virginia Bioinformatics Institute. Please contact them with any questions or comments. For the latest release, The model is available for download in CellDesigner xml format. We have tested that the model is compatible with Cell Designer 4.1. The following is the structure figure of the model, and by clicking on the figure you can navigate the model through a Google-Map-API-enabled CellPublisher user friendly interface.
- Fourth, the latest, release on May 27th, 2012
- Third release on April 28th, 2012
- Second release on January 14th, 2011
- First release on September 15th, 2011
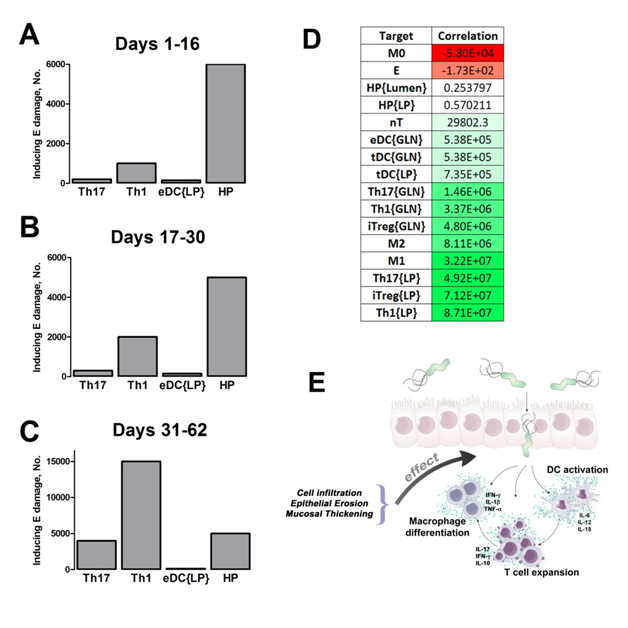 Figure 2. Sensitivity analysis on gastric inflammation lesion formation following Helicobacter pylori infection in silico.
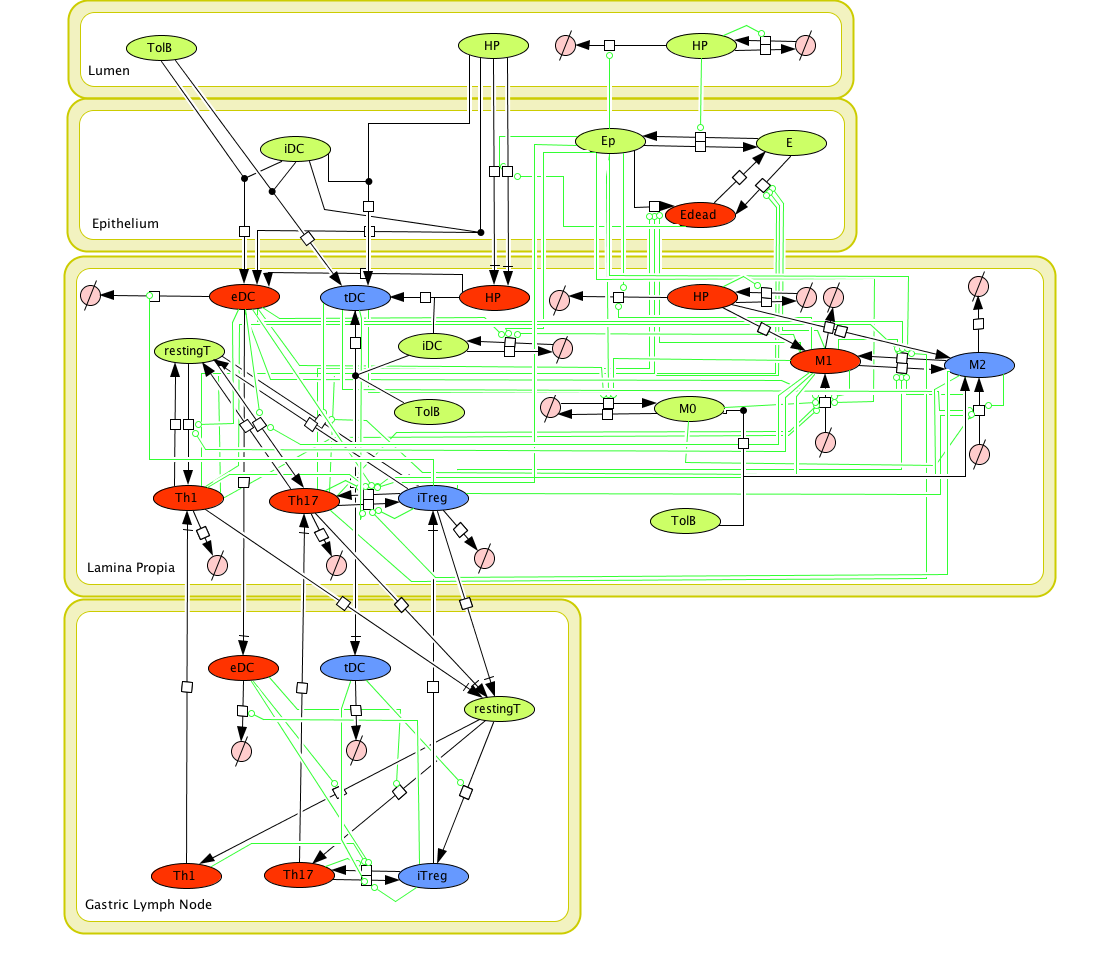 Figure 1. Cell Designer image: ENISI model of H. pylori
Modeling of immune responses towards H. pylori - Agent Based model
Modeling H. pylori using ENISI and Cell Designer Updated on December 29th 2012: The ENISI model has been progressed in the following two areas: Sensitivity Analysis and Cell Movement Modeling. To further characterize the immunological mechanisms underlying mucosal immune responses to H. pylori in a stochastic system, we used ABM based on parameter values derived from our ODE model. When probabilistic approaches are used, the complex immunological processes can be better represented. We adopted the ABM tool ENteric Immune Simulator (ENISI) developed by us and available here. In this case, a stochastic Agent Based Modeling approach has been used to better represent the biological system and add a complementary view on the cascade after infection. ABM adds randomness to the biological systems, which can help to better represent complex cellular responses and to take into account the individual behaviors of cells as well as the role spatiotemporal features. Thus, stochastic models can provide novel insights into the effect of cognate and non-cognate interactions, representing entire systems with a greater granularity and capturing cell-cell interactions. By simulating individual behaviors of agents, ABM better represents cross-linked, complex and nonlinear processes with multiple feedback loops and, provides a more comprehensive and interactive modeling of mucosal immune responses to H. pylori. The ability of ABM to encompass multiple scales of biological processes and incorporate spatiotemporal considerations, coupled with an intuitive modeling paradigm, underscores the added value of this modeling framework in translational systems immunology and immunoinformatics research. Given the complexity, nonlinearity and abundance of feedback loops in mucosal immune responses to H. pylori and to facilitate a better understanding of the mechanisms underlying such immune responses at the systems level, we constructed a SBML network model depicting the major effector and regulatory pathways evoked during H. pylori infection (Figure 1). Three different compartments are represented: gastric lumen, epithelium and lamina propria. Effector subsets are highlighted in red whereas regulatory subsets are highlighted in blue. Some updates on the HP ENISI model contain:
- New states of bacteria have been added which incorporates alive, dead and resting bacteria.
- The lifetime of each cell has been modified. Now each cell has a lifetime with normal distribution with a mean and standard deviation.
- We have changed the model parameters to adequate the model to different scenarios of experimental interest. Those scenarios can be accessed here.
- We have reduced some unnecessary states that were not needed in the system.
- We have created a generator application that creates the initial simulation files. This application has been updated with the additional initial states.
The model is available for download in CellDesigner xml format (right click the link or ctrl+left click for Mac machines to save the model source file). We have tested that the model is compatible with Cell Designer 4.2. The primary MIEP team members responsible for maintaining this model are Maksudul Alam, Adria Carbo and Yongguo Mei at the Virginia Bioinformatics Institute. Please contact them with any questions or comments. (Click on the image for a user-friendly interactive CellPublisher model.)
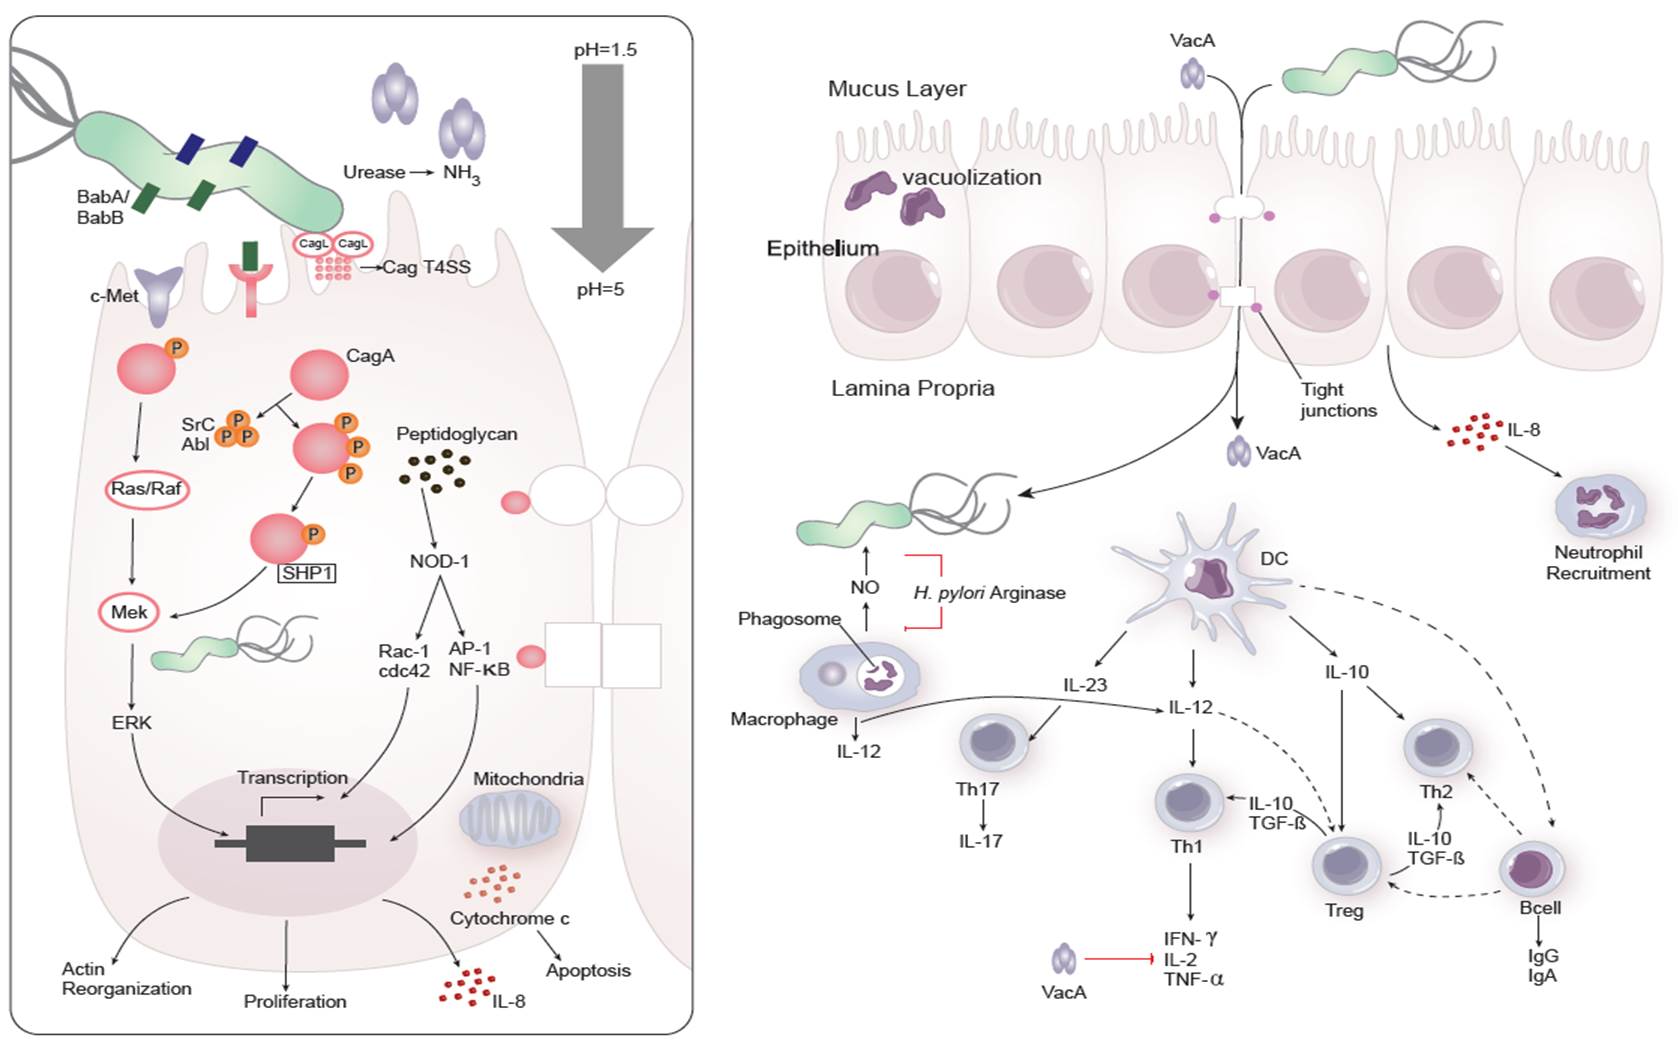 Figure 1. Cellular and molecular pathogenesis of Helicobacter pylori infection
Highlights
- Successfully developed a novel pig model of Helicobacter pylori infection
- Demonstrated for the first time strong cytotoxic CD8+ T cell responses during Helicobacter pylori infection in pigs, further confirming the role of H. pylori as an intracellular pathogen
- Identified the contribution of dysregulated immune responses to gastric inflammatory lesions following Helicobacter pylori infection, particularly by IFNγ-producing Th1 cells and inflammatory macrophages in particular
- Mined large RNAseq datasets from time course studies of macrophage-H. pylori co-cultures
- Identified novel immunological and metabolism genes modulated by H. pylori infection
Background and Epidemiology
Helicobacter pylori are gram-negative, miroaerophilic bacteria responsible for a variety of gastro-duodenal pathologies in the developed and developing world [1]. H. pylori is thought to be indigenous to the human population and is well adapted to colonize and persist in the human stomach. Infection is generally asymptomatic not causing clinical symptoms of those infected people. However, a small percentage of infected individuals will ultimately develop duodenal ulcers and gastric cancer due to the inability of the host immune system to clear the infection.
Pathogenesis
Dozens of bacterial factors are involved in H. pylori molecular pathogenesis (i.e. flagella, urease, catalase, neutrophil-activating protein Nap-A, vacA and cagA). These proteins have revealed many aspects of the relationships between the bacteria, the gastric mucosal surface, and the final outcome of the disease. Two of the most studied virulence factors are vacuolotoxin A (VacA) and the cytotoxin-associated gene A (cagA). Secreted VacA triggers pore formation in the cell membrane, endolysomal trafficking modification, cellular vacuolation, immune cell apoptosis and cell inhibition [2, 3]. CagA is an effector protein injected into the gastric epithelial cells by a type IV secretion system encoded by the cag pathogenicity island (cagPAI). Once inside the host cells, it localizes under the point of bacterial attachment and interacts with the protein zonulin (ZO-1) and the junctional adhesion molecule (JAM) [4]. CagA is then phosphorylated on EPIYA repeats in its phosphotyrosine (PY) region induce secretion of interleukin 8 (IL-8) [5].
Immune response towards H. pylori
As shown in figure 1, the inflammatory response towards H. pylori is initiated through the interaction between the pathogen lipopolysaccharides (LPS) and the Toll-like receptors (TLR) expressed on gastric epithelial cells [6]. Once in the gastric lamina propria, H. pylori is mainly found inside macrophages where their interaction leads to macrophage activation and cytokine release [7]. Macrophages interact with T helper (Th) cells during infection and release cell-polarizing cytokines such as IL-17 [8]. In addition, H. pylori infection also involves neutrophils and increased antigen presenting activity of dendritic cells (DC) [9].
Modeling immunity to H. pylori
MIEP is basically focused on the characterization of the mechanisms underlying immune responses to enteric pathogens by integrating mathematical and computational modeling approaches with experimental data (Figure 2). The integration of modeling and experimental approaches provides unprecedented opportunities for systems-level knowledge discovery. Given the complexity of the host-H. pylori interactions at the systems level and the broad range of possible outcomes, our team has developed a computational model of the gastric mucosal immune response towards H. pylori infection. Currently, the model is able to predict the distinct time-dependent behavior of the three main CD4+ T cells (Th1, Th17 and iTreg) showing an increased Th17 response at the early stage of infection that switches to a Th1 predominance in the chronic phase of the infection.
References
1. Abdulrasheed A, Lawal OO, Abioye-Kuteyi EA, Lamikanra A: Antimicrobial susceptibility of Helicobacter pylori isolates of dyspeptic Nigerian patients. Tropical gastroenterology : official journal of the Digestive Diseases Foundation 2005, 26(2):85-88.
2. Amieva MR, El-Omar EM: Host-bacterial interactions in Helicobacter pylori infection. Gastroenterology 2008, 134(1):306-323.
3. Tanaka S, Mizuno M, Maga T, Yoshinaga F, Tomoda J, Nasu J, Okada H, Yokota K, Oguma K, Shiratori Y et al: H. pylori decreases gastric mucin synthesis via inhibition of galactosyltransferase. Hepato-gastroenterology 2003, 50(53):1739-1742.
4.Amieva MR, Vogelmann R, Covacci A, Tompkins LS, Nelson WJ, Falkow S: Disruption of the epithelial apical-junctional complex by Helicobacter pylori CagA. Science 2003, 300(5624):1430-1434.
5. Eaton KA, Kersulyte D, Mefford M, Danon SJ, Krakowka S, Berg DE: Role of Helicobacter pylori cag region genes in colonization and gastritis in two animal models. Infection and immunity 2001, 69(5):2902-2908.
6. Cullen TW, Giles DK, Wolf LN, Ecobichon C, Boneca IG, Trent MS: Helicobacter pylori versus the host: remodeling of the bacterial outer membrane is required for survival in the gastric mucosa. PLoS pathogens 2011, 7(12):e1002454.
7. Ito T, Kobayashi D, Uchida K, Takemura T, Nagaoka S, Kobayashi I, Yokoyama T, Ishige I, Ishige Y, Ishida N et al: Helicobacter pylori invades the gastric mucosa and translocates to the gastric lymph nodes. Laboratory investigation; a journal of technical methods and pathology 2008, 88(6):664-681.
8. Dong C: TH17 cells in development: an updated view of their molecular identity and genetic programming. Nature reviews Immunology 2008, 8(5):337-348.
9. Zhuang Y, Shi Y, Liu XF, Zhang JY, Liu T, Fan X, Luo J, Wu C, Yu S, Chen L et al: Helicobacter pylori-infected macrophages induce Th17 cell differentiation. Immunobiology 2011, 216(1-2):200-207.
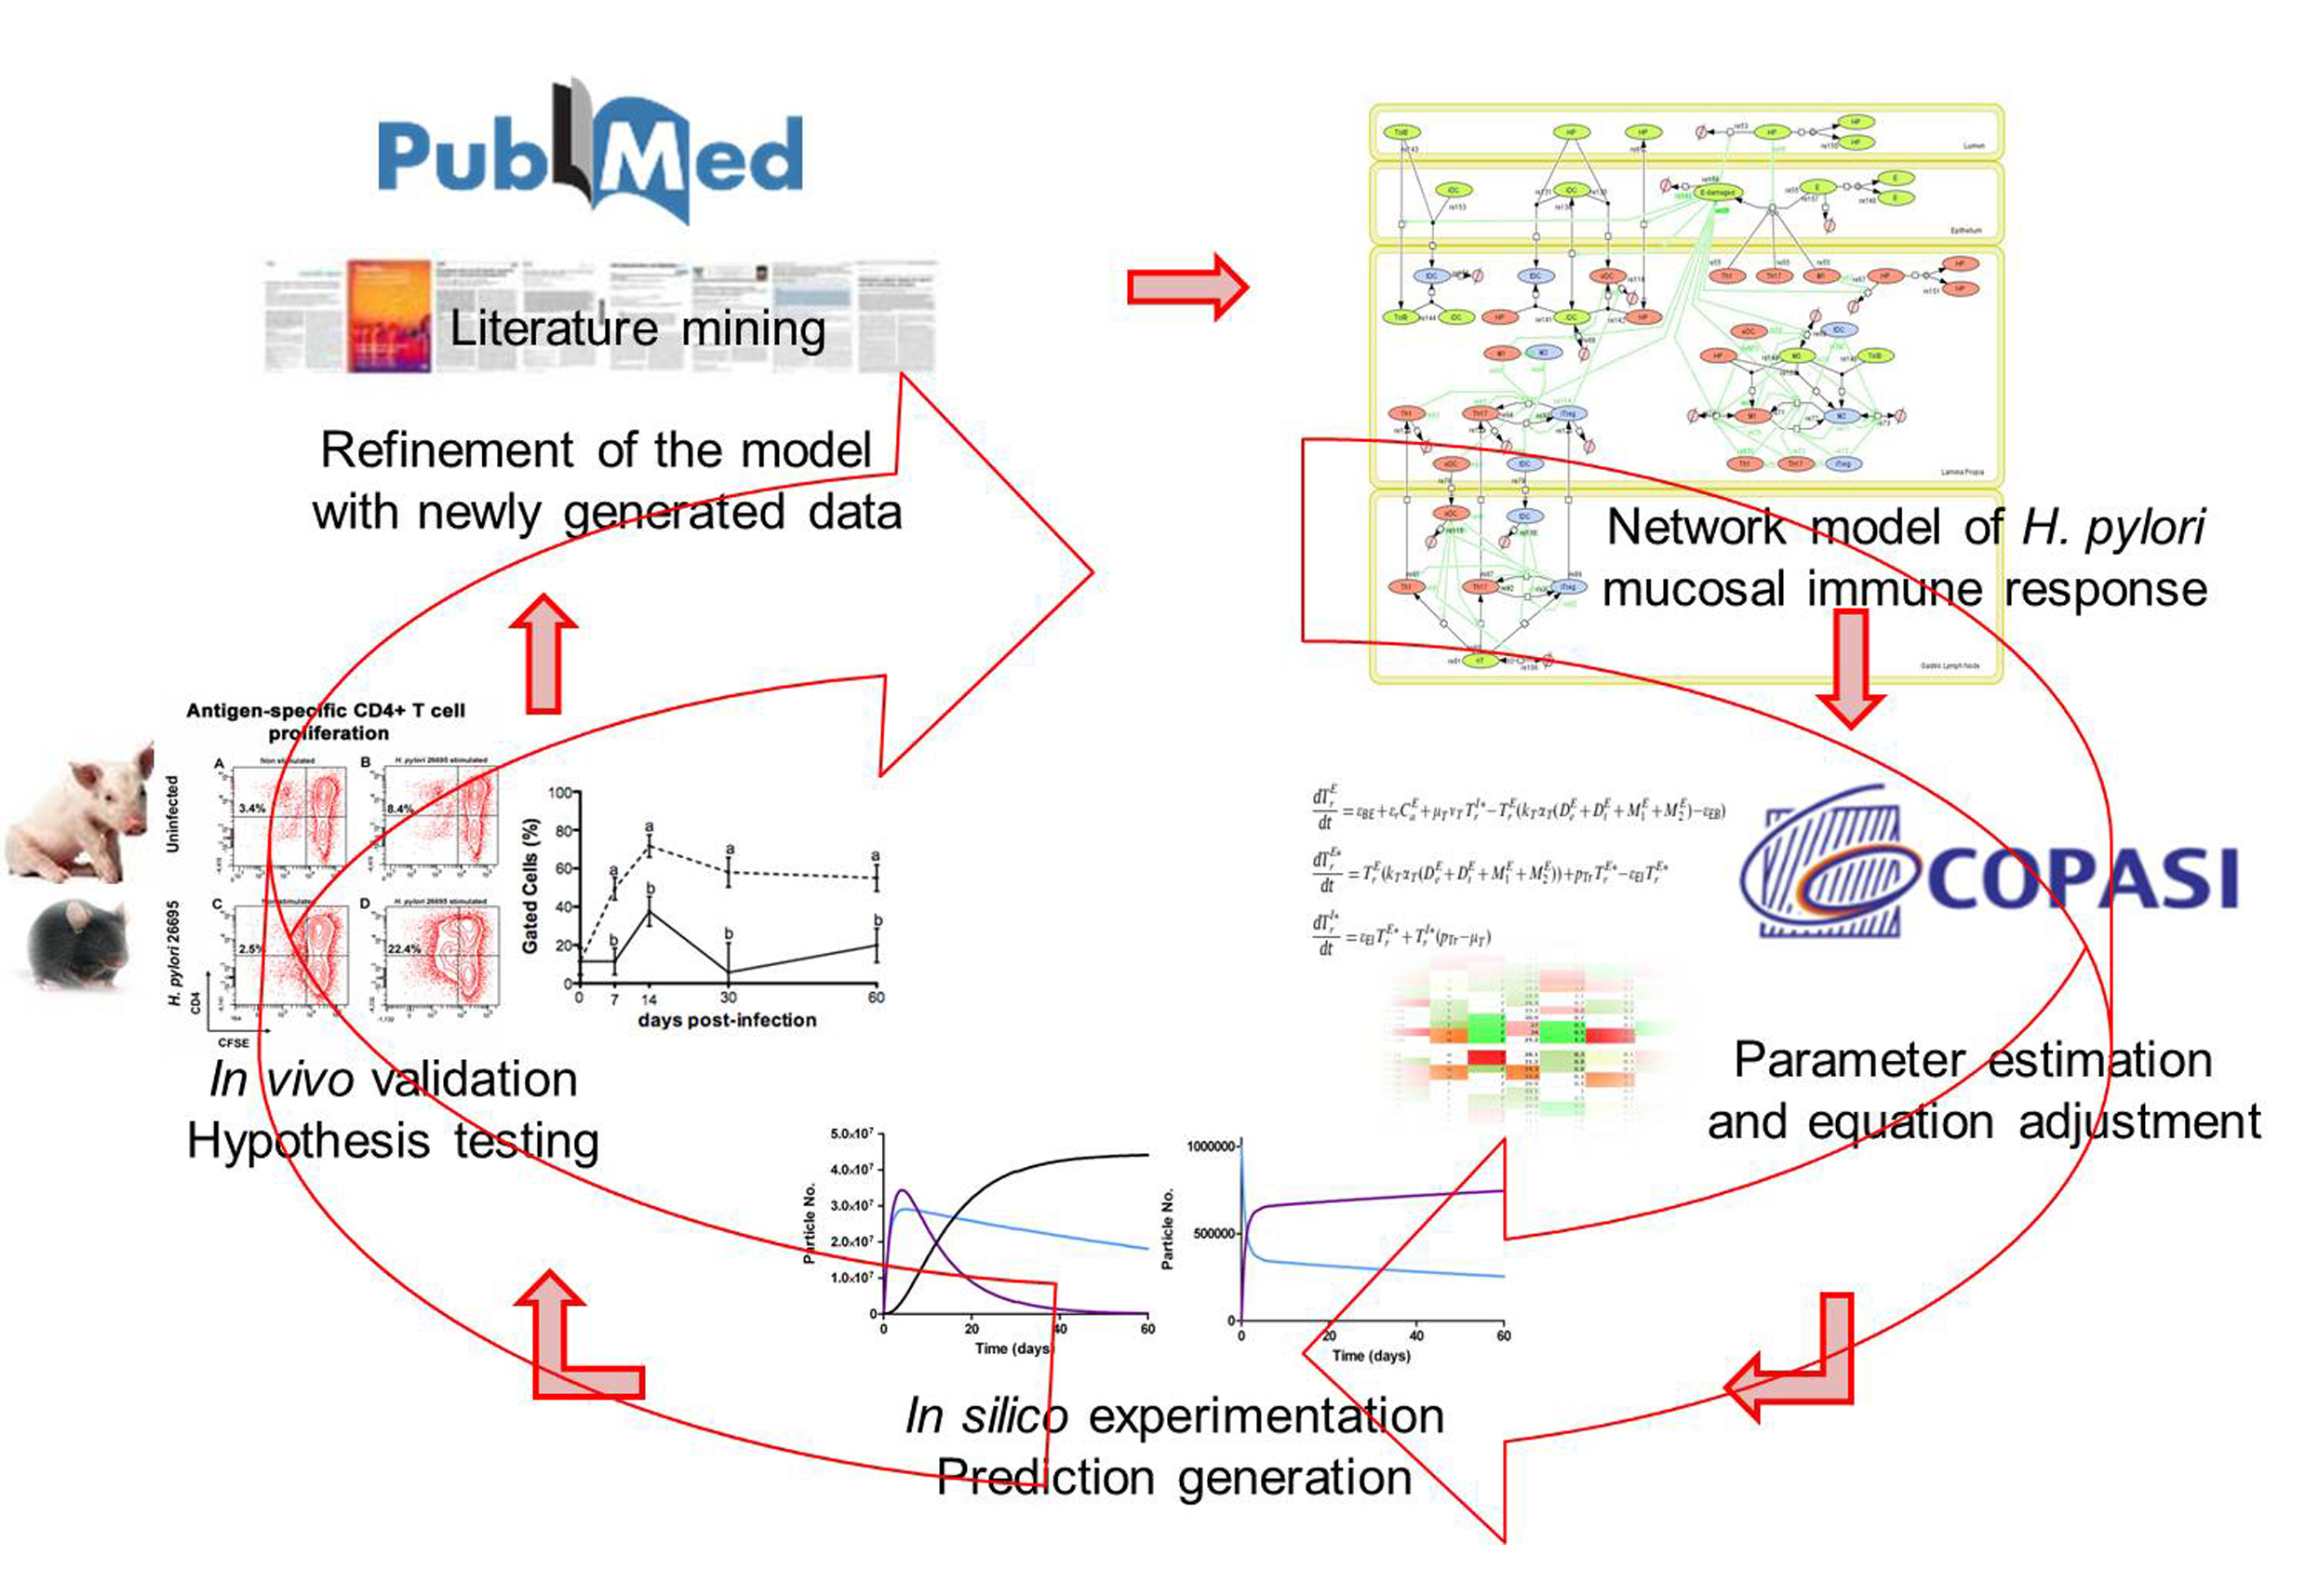 Figure 2. Integration of computational approaches and experimental data.
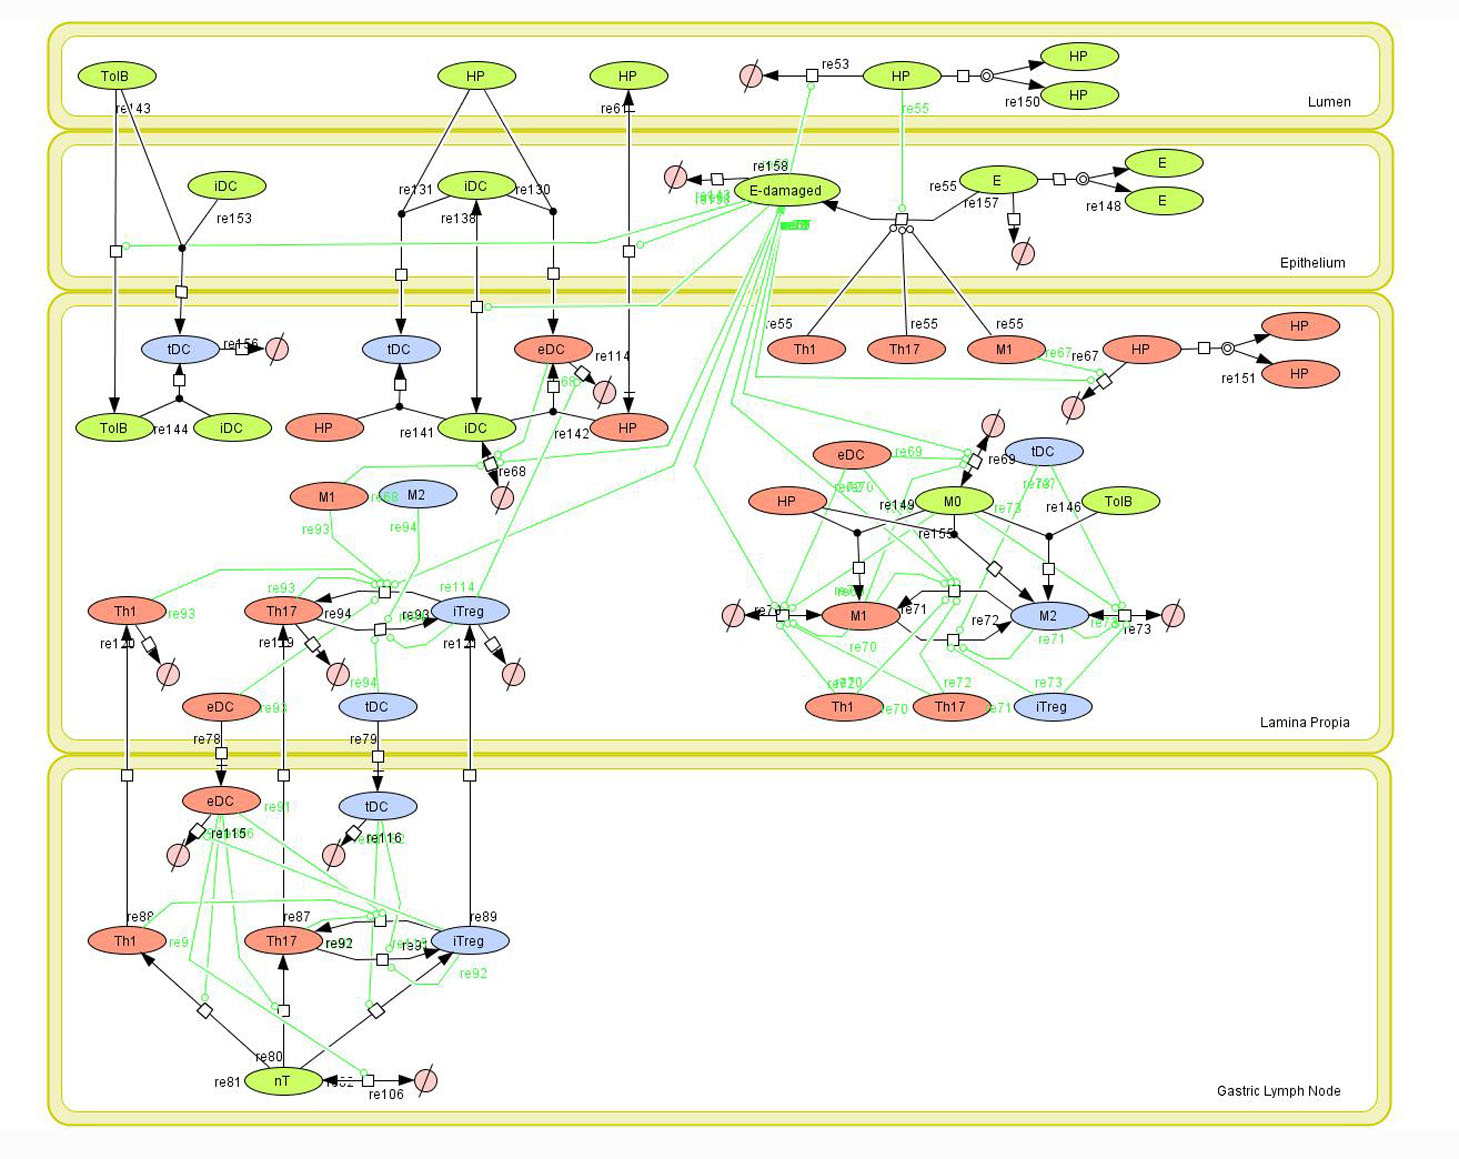 Figure 1. Network model of the mucosal immune responses during Helicobacter pylori infection. Systems Biology Markup
Highlights
- Our predictive model of immune responses towards Helicobacter pylori produced a series of hypotheses that were validated with immunology experiments.
- Simulation results show the induction of a Th17 response and a dominant Th1 response, together with a regulatory response characterized by high levels of mucosal Treg) cells.
- Sensitivity analyses sensitivity analysis predicted a crucial contribution of Th1 and Th17 effector responses as mediators of histopathological changes in the gastric mucosa during chronic stages of infection, which were experimentally validated in mice.
Abstract
T helper (Th) cells play a major role in the immune response and pathology at the gastric mucosa during Helicobacter pylori infection. There is a limited mechanistic understanding regarding the contributions of CD4+ T cell subsets to gastritis development during H. pylori colonization. We used two computational approaches: ordinary differential equation (ODE)-based and agent-based modeling (ABM) to study the mechanisms underlying cellular immune responses to H. pylori and how CD4+ T cell subsets influenced initiation, progression and outcome of disease. To calibrate the model, in vivo experimentation was performed by infecting C57BL/6 mice intragastrically with H. pylori and assaying immune cell subsets in the stomach and gastric lymph nodes (GLN) on days 0, 7, 14, 30 and 60 post-infection. Our computational model reproduced the dynamics of effector and regulatory pathways in the gastric lamina propria (LP) in silico. Simulation results show the induction of a Th17 response and a dominant Th1 response, together with a regulatory response characterized by high levels of mucosal Treg) cells. We also investigated the potential role of peroxisome proliferator-activated receptor γ (PPARγ) activation on the modulation of host responses to H. pylori by using loss-of-function approaches. Specifically, in silico results showed a predominance of Th1 and Th17 cells in the stomach of the cell-specific PPARγ knockout system when compared to the wild-type simulation. Spatio-temporal, object-oriented ABM approaches suggested similar dynamics in induction of host responses showing analogous T cell distributions to ODE modeling and facilitated tracking lesion formation. In addition, sensitivity analysis predicted a crucial contribution of Th1 and Th17 effector responses as mediators of histopathological changes in the gastric mucosa during chronic stages of infection, which were experimentally validated in mice. These integrated immunoinformatics approaches characterized the induction of mucosal effector and regulatory pathways controlled by PPARγ during H. pylori infection affecting disease outcomes.
Summary
Given the complexity, nonlinearity and abundance of feedback loops in mucosal immune responses to H. pylori and to facilitate a better understanding of the mechanisms underlying such immune responses at the systems level, we constructed a SBML network model depicting the major effector and regulatory pathways evoked during H. pylori infection (Figure 1).
In line with our ODE-results, we observed in the ABM that in the GLN, Th1 cells peaked on day 30 post infection and remained at high levels with fairly constant values throughout the rest of the infection period (Figure 2A, 2G). Th17 responses were induced in the GLN and later detected in the LP, together with a Treg cell response that persisted over time in both gastric LP (Figure 2B, 2C) and GLN (Figure 2H, 2I). Regarding Th17 cells, these simulations depicted the immunoregulatory role of PPARg in the myeloid subset since we observed significant differences in enhanced Th17 responses in the myeloid cell-specific PPARg knockout model when compared to the wild-type. Th17 cell numbers were also significantly higher in the T cell-specific PPARg knockout model when compared to the wild-type model in both LP (Figure 2B and 2E) and the GLN (Figure 2H and 2K). T cell-specific PPARg deficiency significantly impaired the expansion of the iTreg cell compartment starting at day 30 and showed an oscillatory behavior and significant differences until day 60 in the gastric LP (Figure 2C and 2F).
We extended our modeling approaches to determine which are the main factors involved in gastric lesion development during H. pylori infection by using sensitivity analysis. Our results using ABM showed how at the early stage of infection (up to week 2 post-challenge), the epithelial cell damage is mainly caused by the bacterium (Figure 3A). Interestingly, we observed a trend towards Th1 and Th17 cells triggering epithelial cell damage starting 3 weeks post-infection. At the chronic phase of the infection our results showed a dominant role of Th1 and Th17 effector cells in inducing epithelial cell damage (Figure 3A). H. pylori induced epithelial cell damage throughout the infection. However, at a later infection stage, the induction of damaged epithelial cells by the effector Th1 and Th17 phenotypes overshadowed the effect of H. pylori itself. Of note, sensitivity analysis performed in the deterministic model at day 60 post-infection also showed similar results (Figure 3B). Going one step further from the model prediction, we hypothesized that the effector T cell response and not the bacterium itself is the main cause of epithelial cell damage during the chronic phase of H. pylori infection. Validating this hypothesis and using wild-type mice that were infected with H. pylori, immunophenotyping results showed a pronounced increase of IL-17A- (Figure 3C) and IFNg-producing cells (Figure 3D) in the gastric LP after 30 and 60 days post-infection. Metronidazole treatment, being an approach to eliminate the bacteria from the stomach at day 30, did not affect effector cytokine expression. These results suggested that effector T cell responses are implicated in lesion development during infection as showed in a cartoon model representation, highlighting the involvement of DC, T cells and macrophages on the formation of gastric lesions in the LP is shown in Figure 3E.
In summary, we combined computational modeling approaches and mouse challenge studies to investigate how CD4+ T cells and other immune cell subsets are distributed in the gut mucosa during H. pylori infection. Our model simulated T cell responses to H. pylori by using both platforms: ODE and ABM. Our modeling efforts predicted higher levels of effector responses in both the LP and the GLN when deleting PPARg, thus highlighting the role of PPARg activation as a potential mechanism for modulating CD4+ T cell responses during bacterial infection and positioning PPARg as a candidate for immunotherapeutics development. Future studies will more fully realize the potential of multiscale modeling to understand mucosal immunity.
References
a) Mei MH, R.; Zhang, X.; Bisset, K.; Eubank, S.; Hoops, S.; Marathe, M.; Bassaganya-Riera, J.; : ENISI Visual, an Agent-based Simulator for Modeling Gut Immunity. IEEE International Conference on Bioinformatics and Biomedicine (BIBM) 2012.
b) Mei Y, Carbo, A., Hontecillas, R., Bassaganya-Riera,J. : ENISI SDE: A novel web-based stochastic modeling tool for computational biology. 2013 IEEE International Conference on Bioinformatics and Biomedicine 2013.
c) Wendelsdorf KV, Alam M, Bassaganya-Riera J, Bisset K, Eubank S, Hontecillas R, Hoops S, Marathe M: ENteric Immunity SImulator: a tool for in silico study of gastroenteric infections. IEEE transactions on nanobioscience 2012, 11(3):273-288.
Data Figures
-
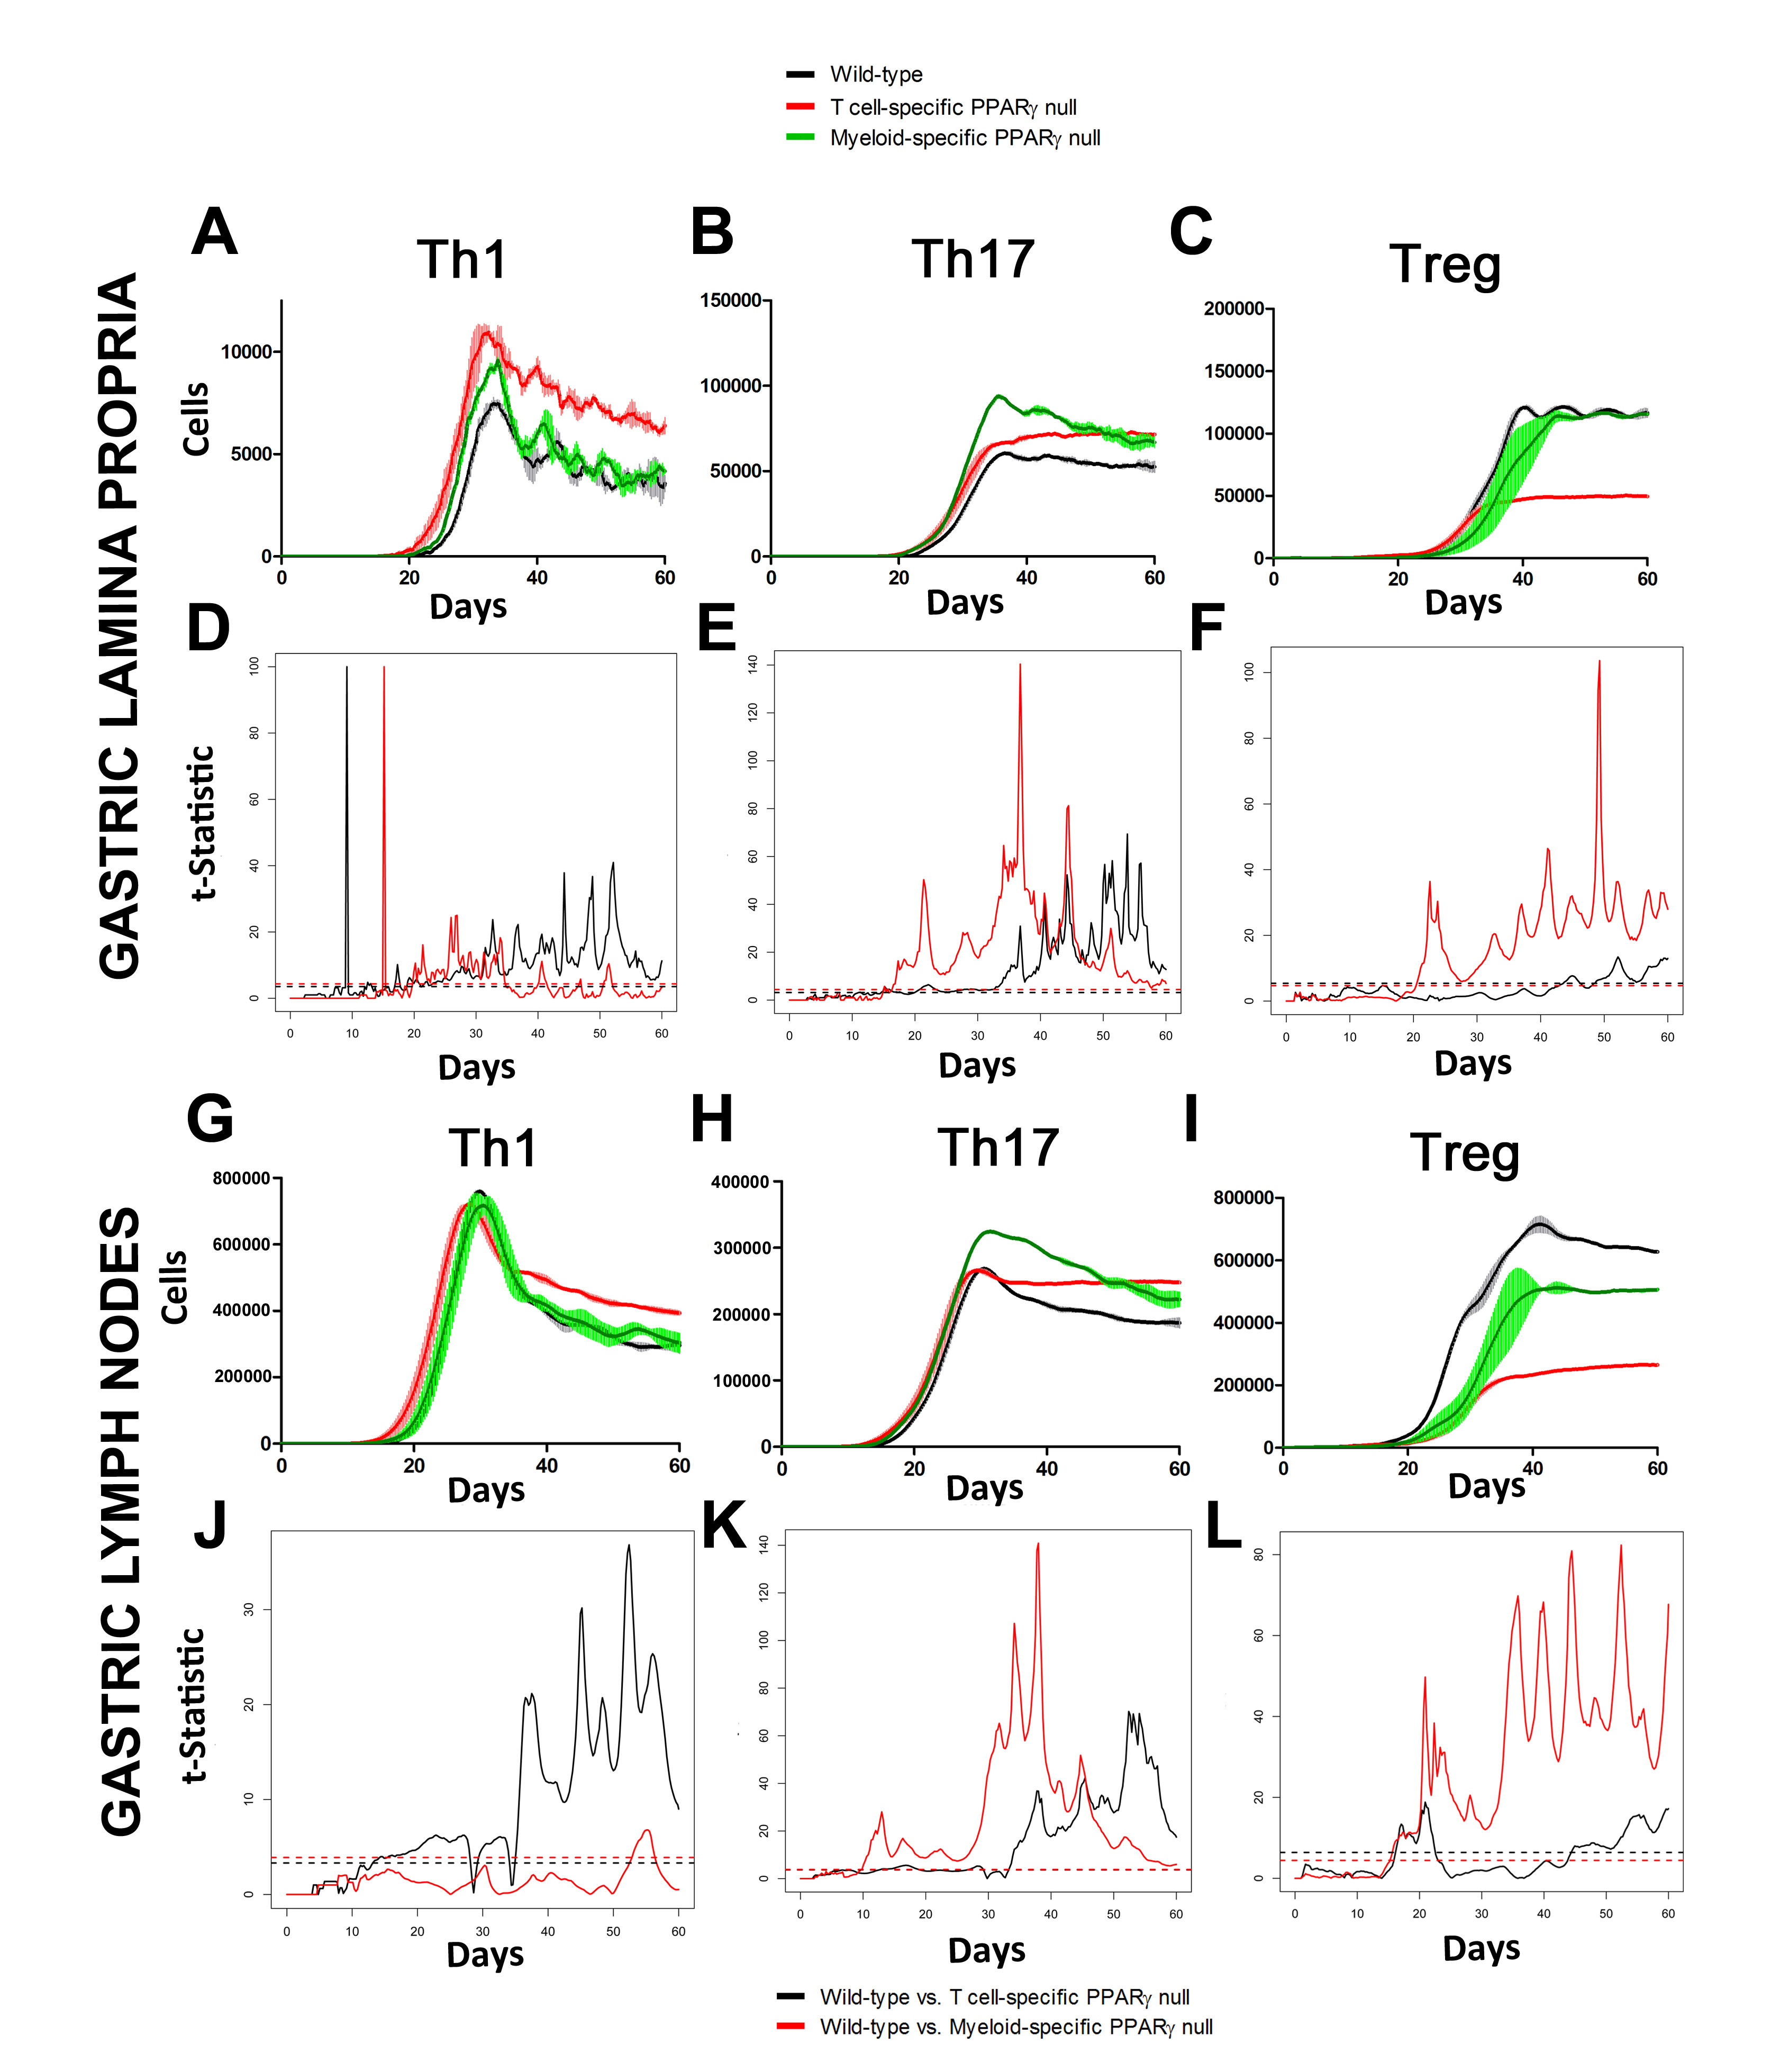 Figure 2. Enteric Immunity Simulator (ENISI) output results and assessment of the role of the Peroxisome Proliferator Activated Receptor g (PPARg) in both the myeloid and T cell subset modulated T cell responses after Helicobacter pylori infection in silico in the gastric lamina propria (LP) and gastric lymph nodes (GLN)
-
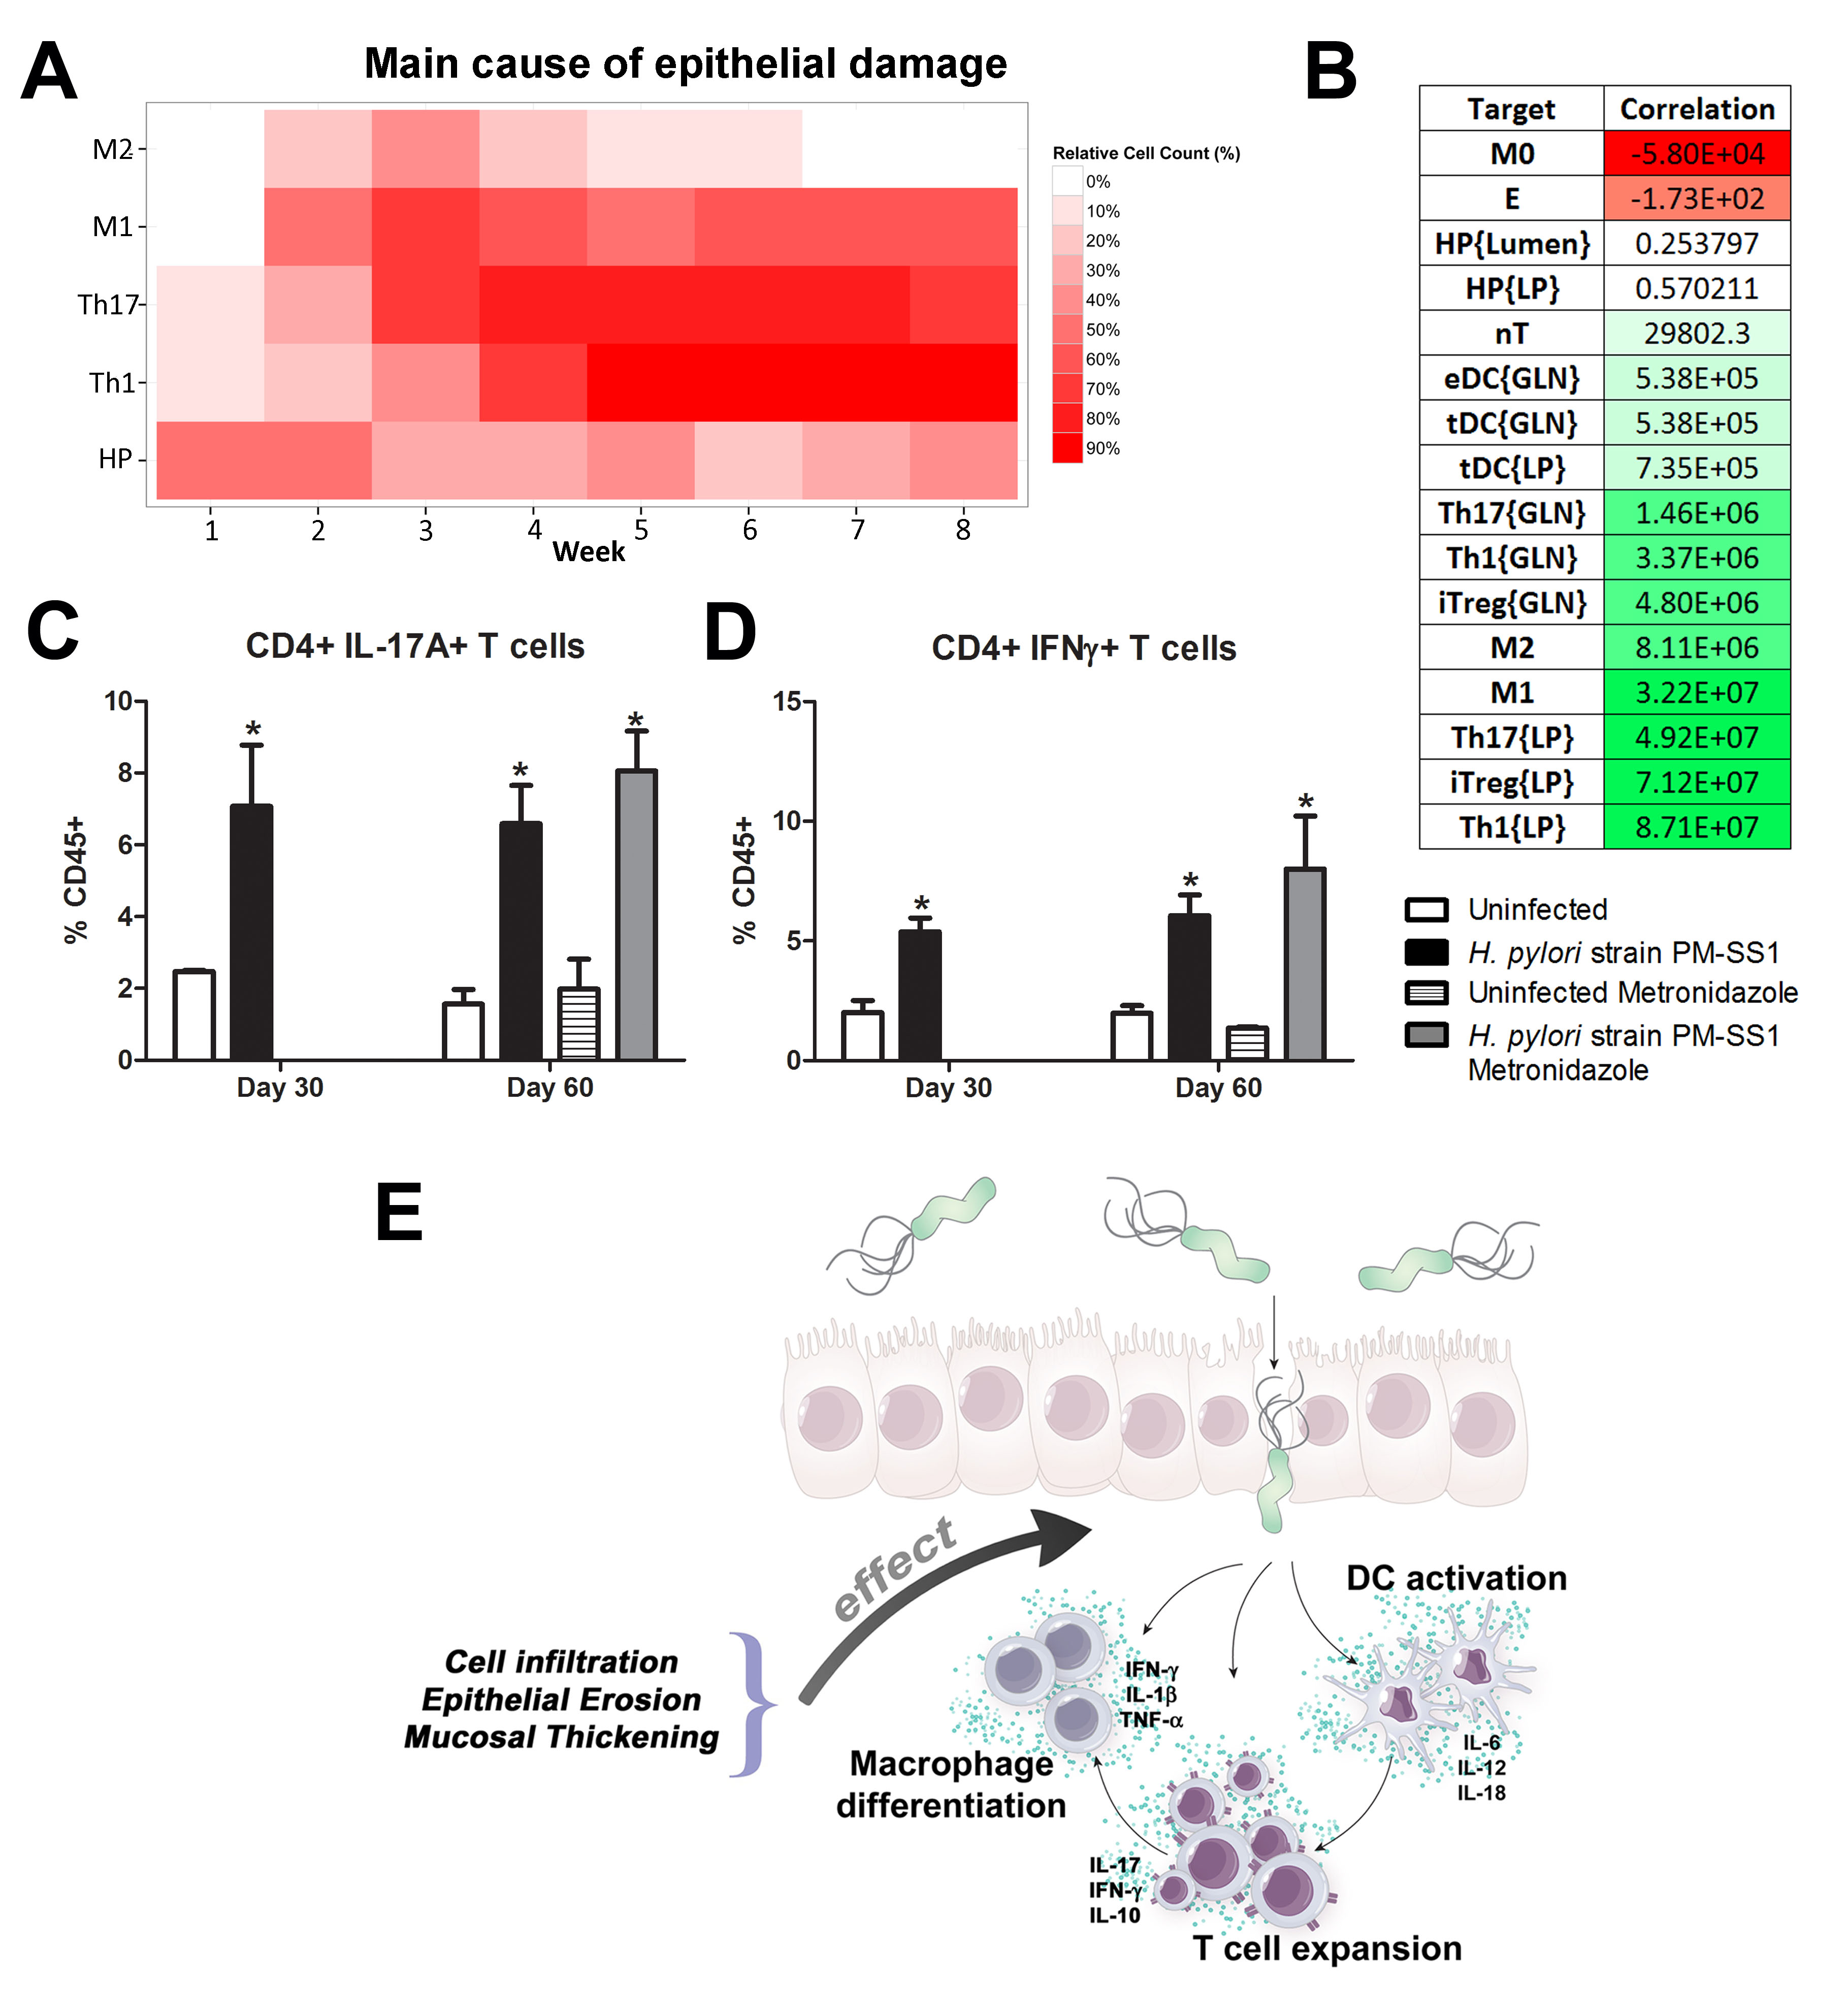 Figure 3. Sensitivity analysis of factors involved in gastric inflammatory lesion formation following Helicobacter pylori infection
 Figure 1. Increase in circulating Th1 cells and IFN-γ expression upon H. pylori infection.
Highlights
- Pigs have greater anatomic, physiologic and immunological similarities to humans than mice, the main animal model used in biomedical research, and therefore have an enhanced translational value.
- The newly developed pig model of H. pylori infection closely mimics what has been reported in human clinical settings.
- Similar to humans, following infection of pigs with H. pylori there was an increase in CD4+ and CD8+ T cells, whereas CD8+ T cells remained unchanged in mouse and gerbil models, the main models used in biomedical research.
- The newly developed pig model allows NIMML to comprehensively and systematically investigate immune responses to H. pylori.
Abstract
Helicobacter pylori infection is the leading cause for peptic ulcer disease and gastric adenocarcinoma. Mucosal T cell responses play an important role in mediating H. pylori-related gastric immunopathology. While induced regulatory T (iTreg) cells are required for chronic colonization without disease, T helper (Th)1 effector responses are associated with lower bacterial loads at the expense of gastric pathology. Pigs were inoculated with either H. pylori strain SS1 or J99. Phenotypic and functional changes in peripheral blood mononuclear cell (PBMC) populations were monitored weekly, and mucosal immune responses and bacterial loads were assessed up to two months post-infection.
Both H. pylori strains elicited a Th1 response characterized by increased percentages of CD4+Tbet+ cells and elevated IFN-γ mRNA in PBMC. A subset of CD8+ T cells expressing Tbet and CD16 increased following infection. Moreover, a significant increase in perforin and granzyme mRNA expression was observed in PBMC of infected pigs indicating a predominant cytotoxic immune response. Infiltration of B cells, myeloid cells, T cells expressing Treg- and Th17-associated transcription factors, and cytotoxic T cells was found in the gastric lamina propria of both infected groups. Interestingly, based on bacterial reisolation data, strain SS1 showed greater capacity to colonize and/or persist in the gastric mucosa compared to strain J99.
This novel pig model of infection closely mimics human gastric pathology and presents a suitable avenue for studying effector and regulatory responses towards H. pylori described in humans.
Summary
To assess whether H. pylori infection affects the expansion of specific T cell subsets, we evaluated the expression of the main transcription factors involved in the regulation of CD4+ T cell phenotype: FOXP3 (iTreg and nTreg), Tbet (Th1) and RORγt (Th17). An elevated proportion of CD4+ T cells expressed the Th1-associated transcription factor Tbet in response to H. pylori (Fig. 1A). We observed a transient single peak at day 7 post-infection followed by a sustained increase in CD4+Tbet+ cells from day 28 to day 49 post-challenge in SS1-infected pigs. The same pattern was found in J99-infected pigs except that the response declined by day 49 post-challenge. The percentage of RORgt+CD4+ T cells was significantly different on days 21 post-infection for SS1 and days 28 and 49 post-infection in J99-infected pigs (Fig. 1C). There was a more notable decline in the expression of the Treg-associated transcription factor FOXP3 in CD4+ T cells from pigs infected with the strain SS1 on day 28 post-infection (Fig. 1D) which mirrored the increase in Tbet and coincided with increased transcripts of IFN-g mRNA in PBMC for both SS1 and J99-infected pigs (Fig. 1B). These results provided the first indication of a predominant Th1 response induced in our experimental model by H. pylori.
CD4+ T cells expressing the T cell lineage specific transcription factors (A) Tbet (Th1), (C) RORγt (TH17) and (D) FOXP3 (iTreg, nTreg) were detected by flow cytometry. IFN-γ mRNA levels in PBMC were measured by qRT-PCR (B). Symbols indicate statistical differences between either the H. pylori J99 (#) or SS1 (*) infected group to the control group and between both infected groups (&), n=8-9, mean±SEM, p≤0.05.
Furthermore, we demonstrate that H. pylori infection results in a significant increase of Tbet expressing cytotoxic CD8b+ T cells (Fig. 2A-B). The shift in Tbet expression was first detected on day 35 post-infection when on average 62% of cells had detectable amounts of this transcription factor. The percentage of CD8b+Tbet+ cells declined thereafter although towards the end of the study, on day 49 post-infection, there were still significant differences between infected and non-infected pigs. A closer analysis revealed the expansion of circulating CD8β+ T cells (Fig. 2C) and an increase of CD16 expression on those circulatingCTL (Fig. 2D) upon infection. Furthermore, CD3-CD8a+ NK cells were significantly increased in blood of SS1-infected pigs on day 35 post-infection (Fig. 2E).
Expression of Tbet was assessed in peripheral CTL (CD8β+) on day 42 post-infection (A) and over time (B). Representative flow cytometry dot blots for non infected and H. pylori J99 and SS1 infected pigs are presented. Numbers indicate percentage of positive cells within the single cell population (A). The number of (C) CTL (CD8β+) and (E) NK cells (CD3-CD8α+), were enumerated in PBMC over time. Numbers of cells per ml of blood were calculated by applying the percentage of immune cells obtained by flow cytometry to the concentration of cells in whole blood. The percentage of CD16 expressing CTL was assessed throughout the study (D). Gene expression levels of perforin (F), granzyme A (G) and granzyme B (H) in PBMC were analyzed over time. Symbols indicate statistical differences between either the H. pylori J99 (#) or SS1 (*) infected group to the control group and between both infected groups (&), n=8-9, mean±SEM, p≤0.05.
In concordance with the observed expansion of circulating cytotoxic T cells, we detected a significant upregulation in the expression of genes involved in the cytotoxic activity of CTL and NK cells, perforin, granzyme A and B (Fig. 2F-H). Overall our data suggest the initial induction of an IFN-g-producing Th1 response orchestrated by the transcription factor Tbet and executed by cytotoxic T cells.
Re-isolation of H. pylori from infected pigs was performed at the end of the study. Overall, H. pylori SS1 was recovered from the stomach of all pigs in that group, while H. pylori J99 could only be re-isolated from 8 out of 12 pigs. When looking at bacterial burden in different regions of the stomach we found that the percentage of re-isolation was consistently higher in the SS1-infected group than in the J99 group with the exception of the fundus-A sub-region which showed similar frequencies for both strains (Fig. 3B). Microscopic changes were present in the stomach of both infected groups and were characterized by significant expansion and development of organized lymphoid aggregates and diffuse leukocytic infiltration. Both strains of H. pylori induced organized lymphoid tissue in the stomach mucosa, which was more predominant in the cardiac region (Fig. 3A).
Representative images were taken from hematoxylin and eosin stained specimens collected from the stomach region cardiac B (CB) and pyloric A (PA) of non infected and infected pigs at 10× magnification (A). H. pylori J99 and SS1 were re-isolated from 6 stomach locations at 2 months post-infection. Re-isolation data is expressed as percentage (B).
In summary, our findings that H. pylori elicits Th1 and CTL responses in a novel pig model correlate well with its role as a facultative intracellular pathogen. Clinical and in vitro studies with human cells provide increasing evidence that cytotoxic immune responses play a crucial role in H. pylori pathogenesis. Our data demonstrates for the first time an increase in circulating CTL and NK cells peaking on day 35 post-infection which coincides with increased IFN-γ gene expression.
The exact role of CD8+ T cells and whether they contribute to the depletion of H. pylori from the gastric mucosa deserves further investigation. Findings from re-isolation and histopathology suggest that CD8+ T cell responses elicited upon infection might be ineffective in the elimination of bacteria but rather contribute to tissue damage. Furthermore, the infiltration of regulatory cells found in the stomach at least partially counteracts proinflammatory responses and contribute to bacterial persistence.
Here, we present the first pig model of H. pylori infection that corroborates in an experimental setting that the predominant Th1 response induced by the bacterium leads to the expansion of cytotoxic cells, including CTL and NK cells. The hallmark of the immune response to H. pylori in humans is the infiltration of Treg cells, neutrophils and Th1 cells. We have been able to reproduce these findings in our pig model, showing infiltration of myeloid cells and FOXP3+ T cells suggesting the presence of Tregs in the gastric mucosa. Furthermore, our model shows a strong systemic Th1 response followed by cytotoxic T cell responses. Similar to H. pylori mediated chronic gastritis in humans, bacteria are able to persist in the pig stomach but at the expense of lesion development. While the role of CD8+ T cells in mouse models of H. pylori has only been studied using immunodeficient mice lacking CD4+ T cells, our pig model provides a more suitable in vivo system to study cytotoxic immune responses towards H. pylori observed in humans and an ideal setting for testing new therapeutic approaches.
Link to the raw data can be found here.
Link to the publication can be found here.
Link to the press release can be found here.
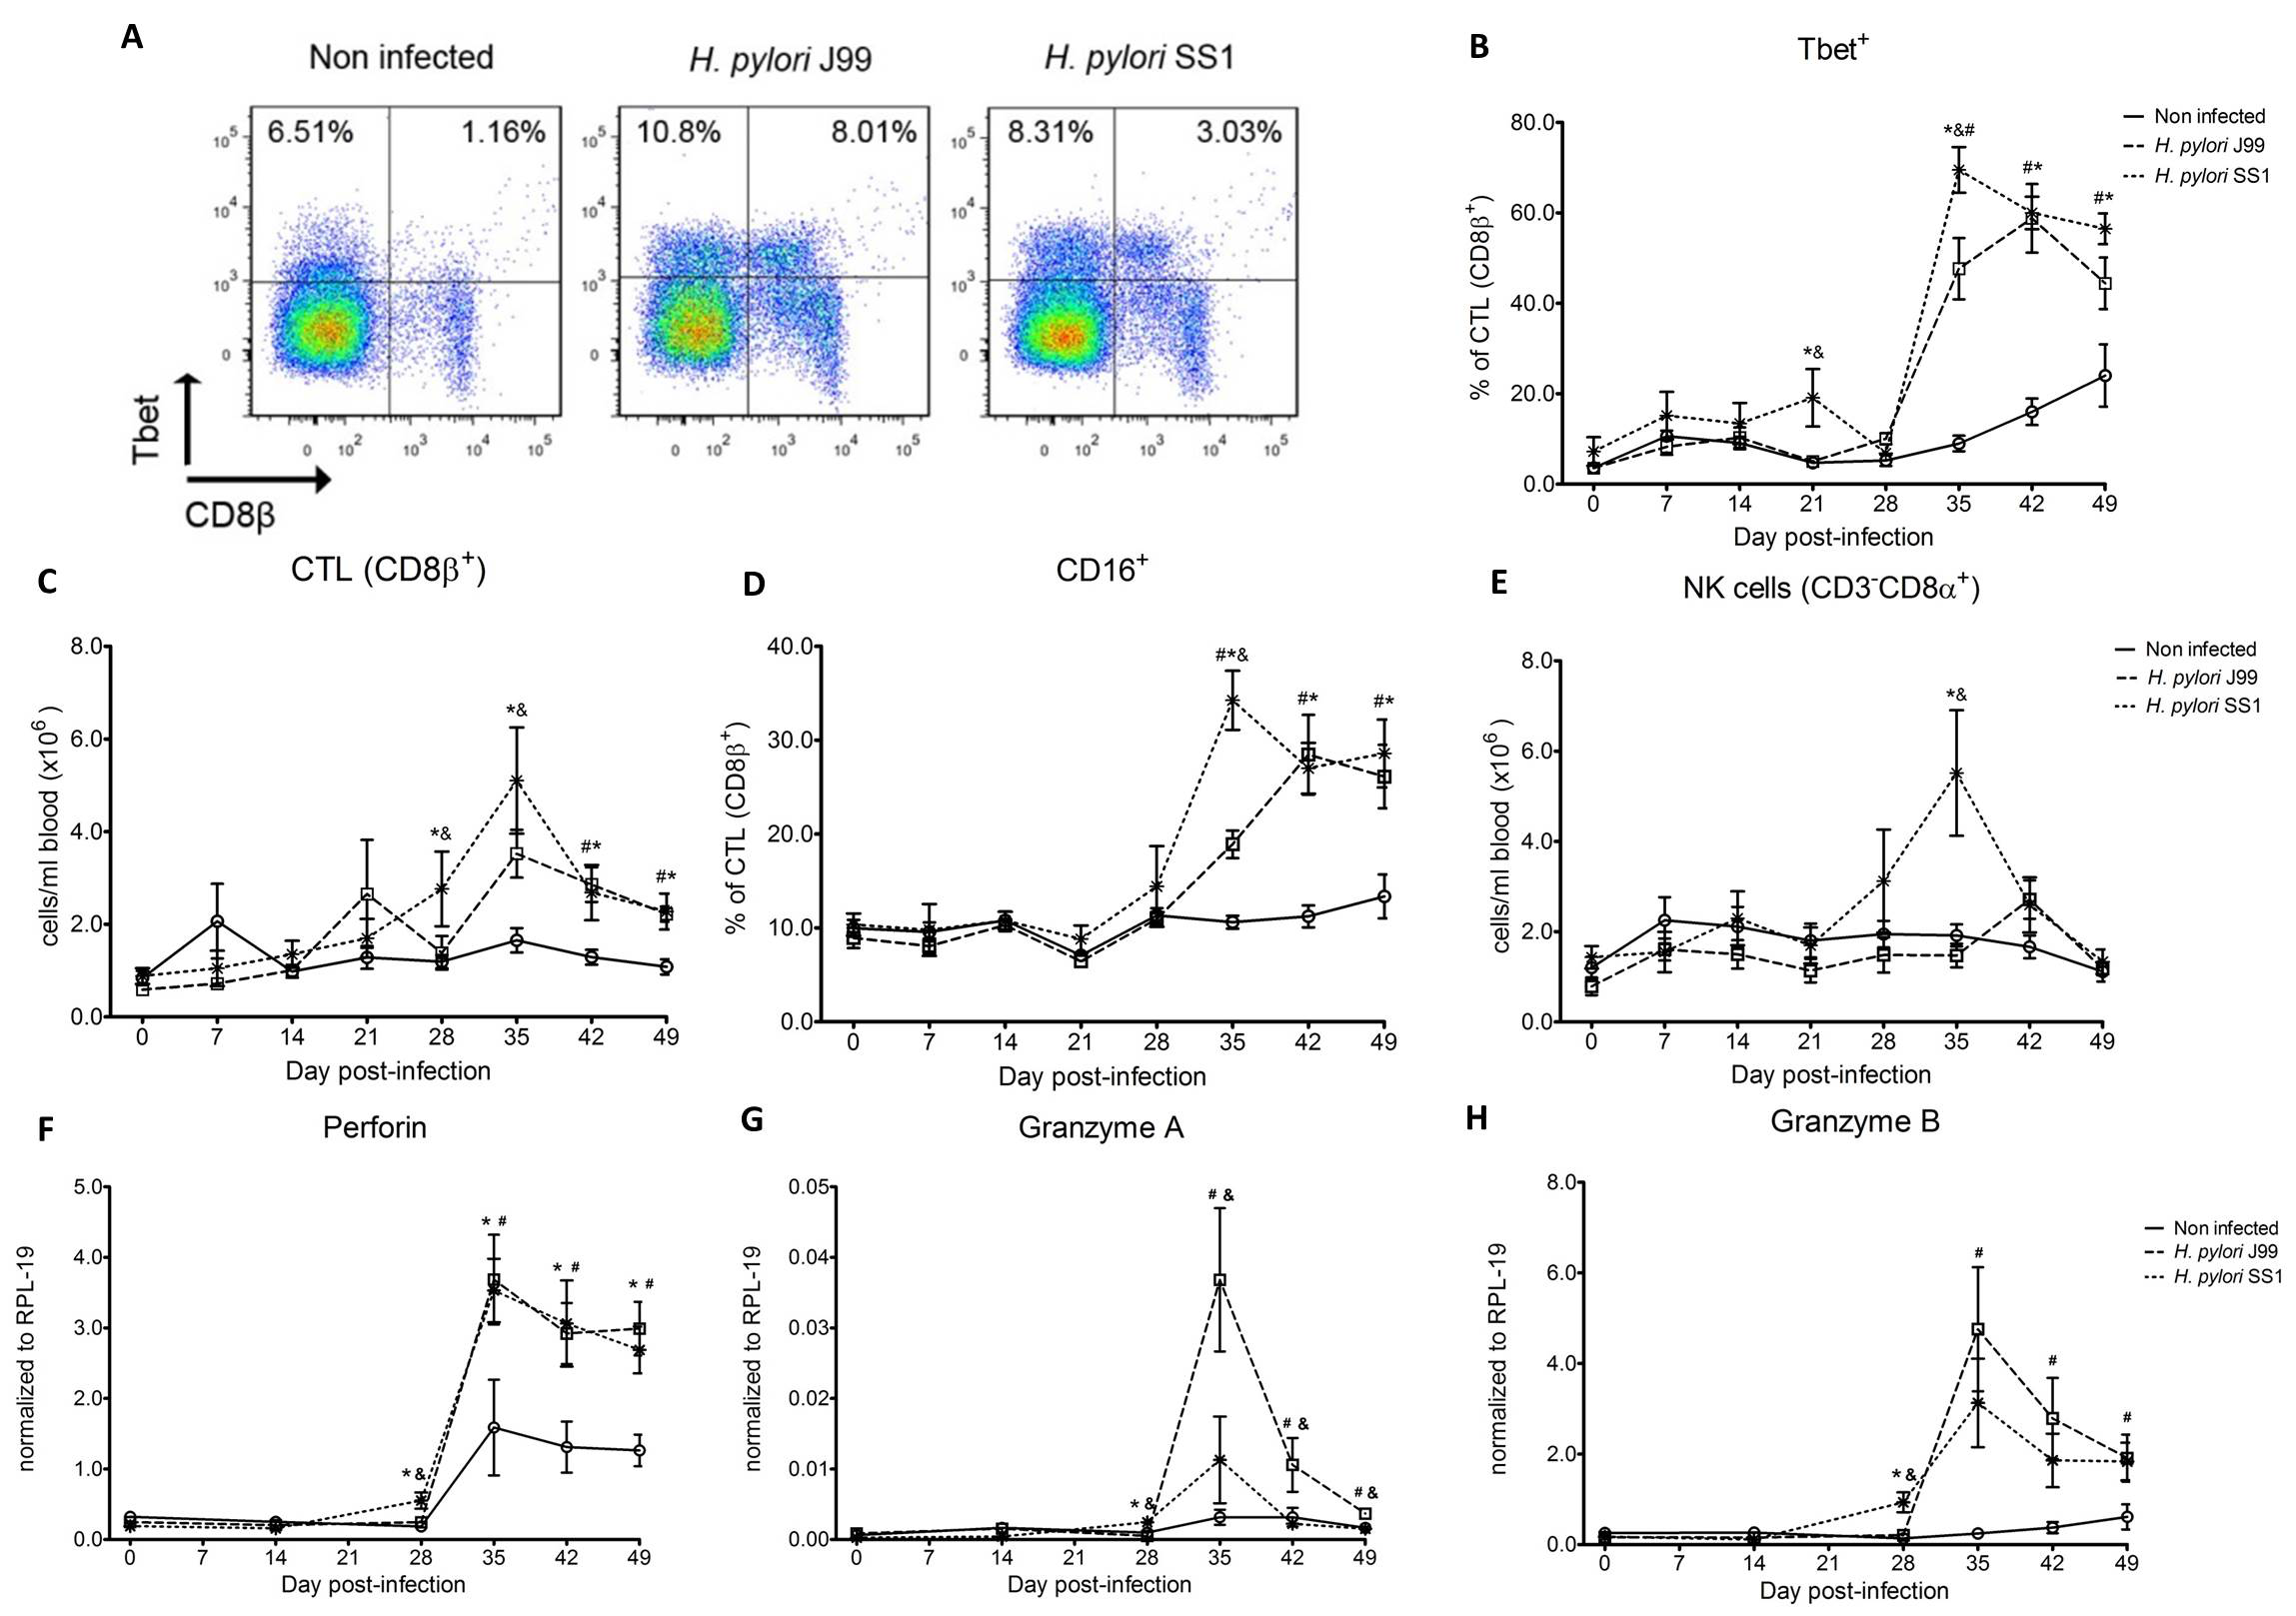 Figure 2. Increased circulating and functional cytotoxic cells upon H. pylori infection.
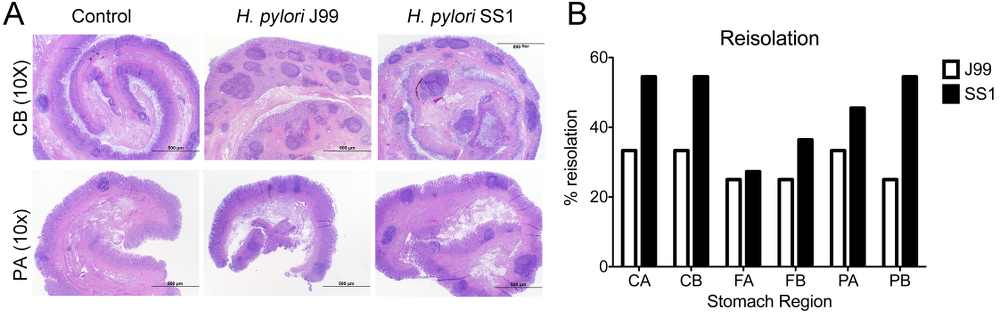 Figure 3. Lesion development upon H.pylori infection and the lack of bacterial clearance upon long-term infection with strain SS1.
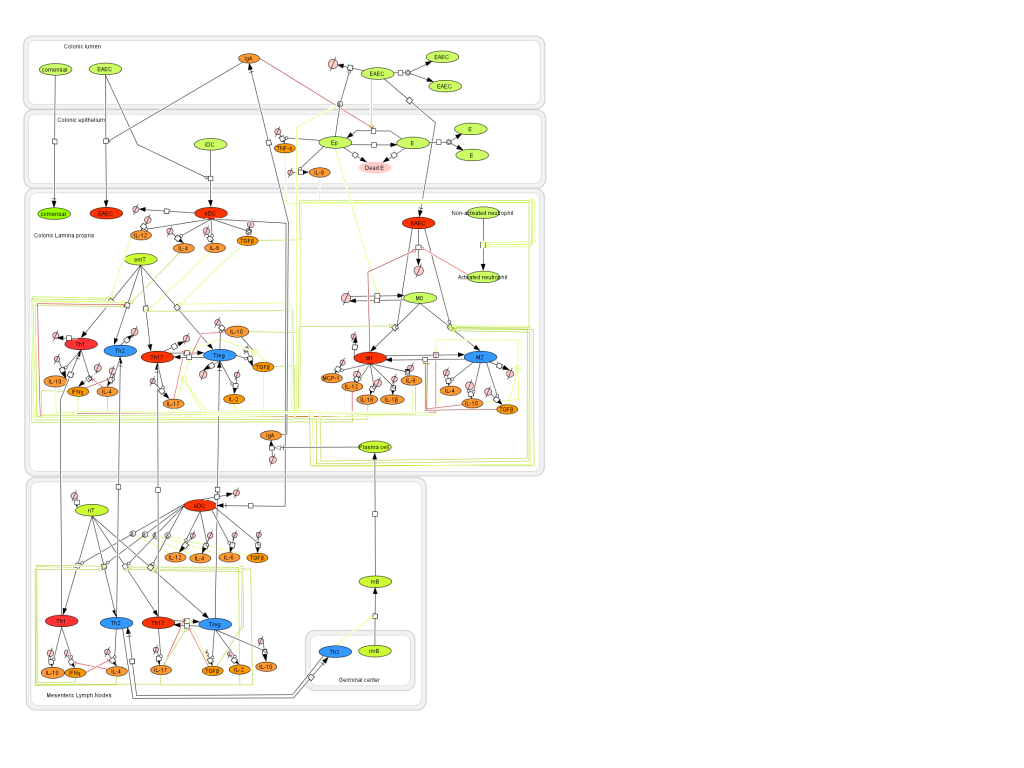 Figure 1. EAEC Model
Highlights
- Immune responses to EAEC are complex and involve coordination between numerous cell types, signaling molecules, the microbiome and diet.
- NIMML uses ODE-based computational modeling as a novel framework to characterize unintuitive biological interactions governing host defenses against EAEC in the intestine. We have focused on modeling T cells, epithelial barrier responses and mucosal immunity as a whole during EAEC infection.
- Modeling immune responses to EAEC has allowed NIMML to successfully predict novel interventions for treating bacterial infection. Specifically, our T cell model shows that promoting CD4+ Th17 expansion by blocking PPARγ leads to beneficial immune responses and bacterial clearance.
- Our ongoing research involves modeling the integration of immunity and metabolism during EAEC infection.
Ongoing Efforts
The following is a list of archived EAEC computational model releases. Please click on individual releases for more details.
- Fourth, the latest, release on July 2nd, 2012
- Third release on April 28th, 2012
- Second release on Jan 12th, 2012
- First release on Oct 30th, 2011 The primary MIEP team members responsible for maintaining this model are Monica Viladomiu, Mireia Pedragosa and Cassandra Washington at the Virginia Bioinformatics Institute. Please contact them with any questions or comments. For the latest release, the model is available for download in CellDesigner xml format. We have tested that the model is compatible with Cell Designer 4.1. For this release, we have changed replication of EAEC in the lumen as well as the epithelial cells. This is to allow the model to exist in a steady state prior to simulating an infectious challenge. The following is the structure figure of the model, and by clicking on the figure you can navigate the model through a Google-Map-API-enabled CellPublisher user friendly interface.
 EAEC
EAEC
About
The following is a list of archived EAEC T Cell differentiation computational model releases. Please click on individual releases for more details.
- First, the latest, release on October 31st, 2012
In vivo data provides strong evidence that Th17 cells play a primary beneficial role in bacterial clearance during EAEC infection. In order to predict unintuitive pathways necessary for bacterial clearance and target potential therapeutics, we have honed in on the importance of T cells for EAEC-disease amelioration. The EAEC T cell differentiation model is a simplified depiction of EAEC infection, antigen presentation, and the host’s adaptive immune response to pathogen. The initial step towards calibrating underlying mechanisms of infection was to isolate parameters of interest from the more complex EAEC model; most specifically those regulating T cell differentiation and bacterial clearance. Primary purposes for the EAEC T cell differentiation model include:
- Capture quantified dynamics of interest
- Calibrate kinetics involved in T cell differentiation during EAEC infection
- Exclude arbitrary and unknown measures in the biological system
- Make predictions for the importance of T cell subsets during EAEC infection
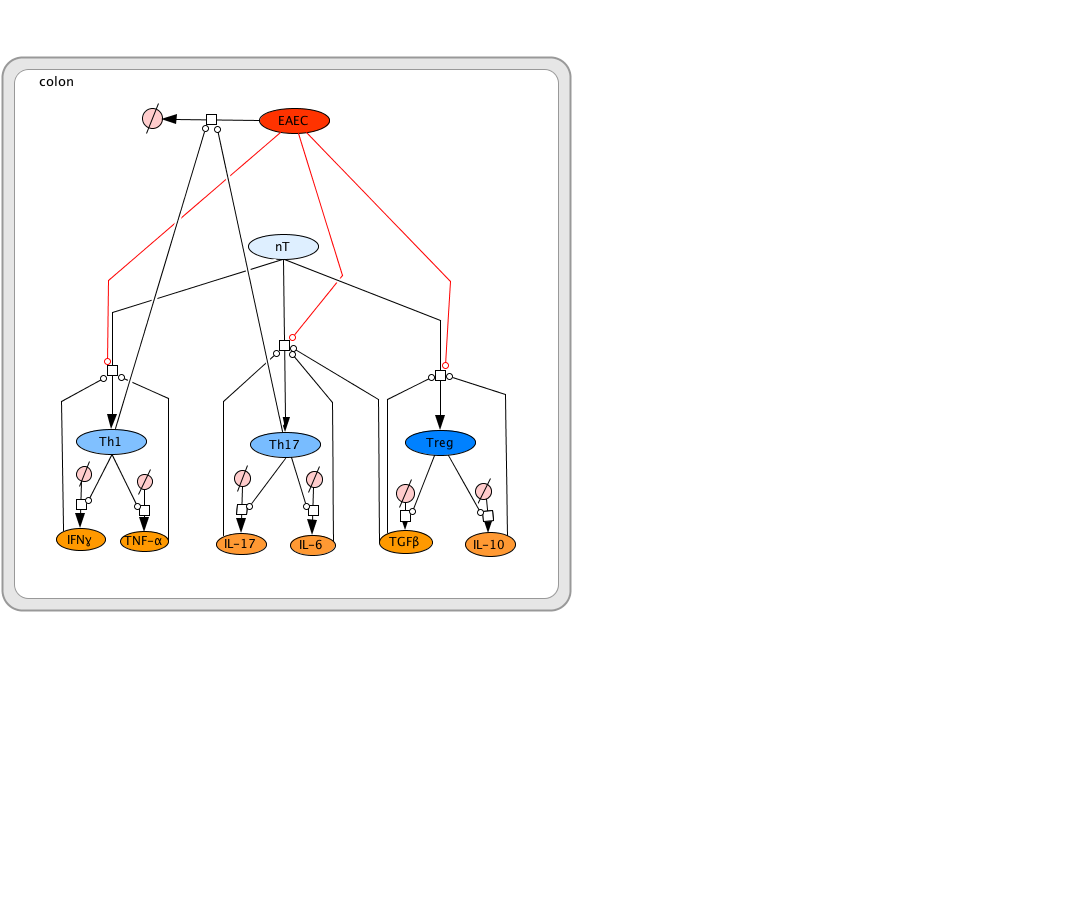
The CellDesigner network was liked to COPASI for calibration. Parameter estimation was performed using in house time course data from a malnourished EAEC-infected mouse model and the particle swarm algorithm in COPASI. Currently the model effectively predicts: As more data is generated through validation studies, the model will be refined and built up to encapsulate additional cell types and more complex molecular pathways. In doing so, we aim to elucidate the physics underlying host-EAEC interactions in a holistic manner to generate a novel computational model that maintains its predictive capabilities.
- A beneficial role of an early proinflammatory response
- The magnitude of changes in immune cells and cytokines in response to PPAR γ blockade
- A beneficial Th17 response when PPAR γ functionality is diminished
- Disease amelioration and EAEC clearance by day 5 due to proinflammatory responses heightened due to PPAR γ deficiency
Modeling immune responses to EAEC
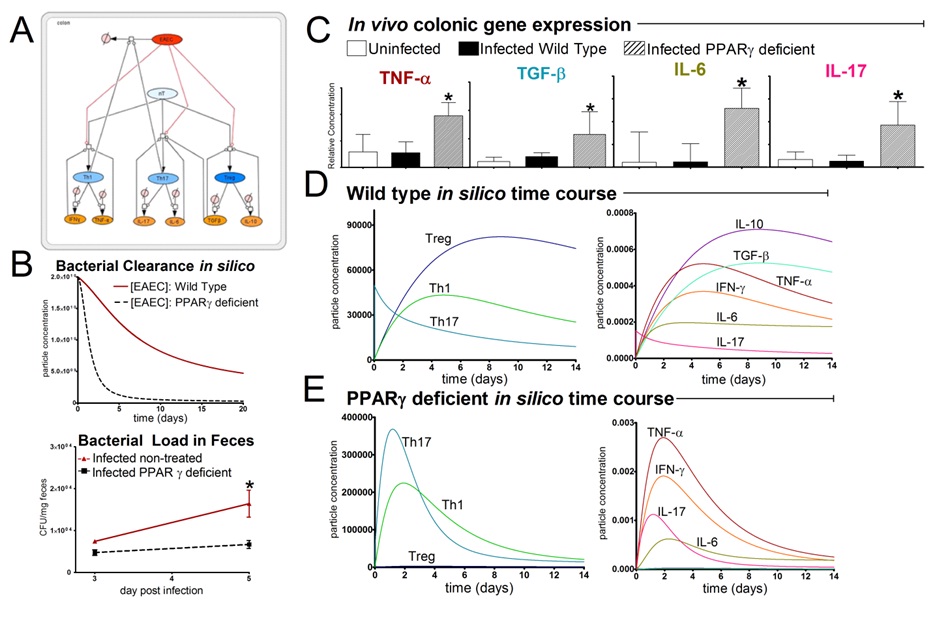
The EAEC T cell differentiation model network created in CellDesigner using systems biology markup language (A) was linked to COPASI software for the calibration. A calibrated wild type system was created using in house data from malnourished EAEC strain JM221 infected mice(C) (asterisks indicate statistical significance; p<0.05
). PPARγ deficiency was simulated by modulating the parameters regulating T cell differentiation into separate phenotypes; Th1 and Th17 cell differentiation was enhanced equally while Treg differentiation was decreased in an equal magnitude. Bacterial clearance predicted in silico mimicked EAEC quantification in feces from infected mice (B). In silico simulations of a time course infection over 14 days were performed using COPASI. The wild type system (D) portrays immunodeficiency while the PPARγ deficient system (E) predicted enhanced effector responses. The primary MIEP team member responsible for maintaining this model is Cassandra Philipson at the Virginia Bioinformatics Institute. Please contact her with any questions or comments. For the latest release, the model is available for download in CellDesigner xml format. We have tested that the model is compatible with Cell Designer 4.2. The following is the structure figure of the model, and by clicking on the figure you can navigate the model through a Google-Map-API-enabled CellPublisher user friendly interface.
Data Figures
 EAEC T Cell Differentiation Model
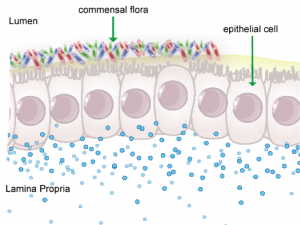 Figure 1. Anatomical representation of the colonic epithelial barrier
About
In mammals, the epithelial barrier represents the largest organ in the body as it lines the entire gastrointestinal tract from mouth to anus in one continuous monolayer. Epithelial cells in the gastrointestinal tract exist as the interface between a host and the external environment providing the first line of defense from the immune system towards invasion. The colonic epithelial barrier represents one of the most critical regulatory networks in an individual. Firstly, it functions as the essential barrier allowing nutrient absorption and uptake. Additionally, the epithelial barrier coexists and communicates with trillions of commensal microorganisms, collectively the microbiome, and is responsible for generating host immune responses for both tolerance and defense.
Individual epithelial cells line up side by side and are connected by tight junction proteins to maintain one protective monolayer; the epithelial barrier. Commensal bacteria reside on the luminal surface of epithelial cells and peacefully co-exist as non-pathogenic residents. Epithelial cells can signal by rapidly producing chemical messengers (cytokines and chemokines) in the underlying lamina propria to recruit cells necessary for immune homeostasis or defense.
Gut Turnover
Proliferation, mitotic cell division to form two cells, is a critical process for robust cell turnover used to facilitate rapid production of functional epithelial cells in the gut. Stem cells constitute the highly proliferative cell population responsible for dividing and replenishing the availability of progenitor cells that further proliferate and differentiate to form specialized mature epithelial cells. In the colon, an estimated 300 epithelial cells arise from one common stem cell ancestor within a 24-hour period. Remarkably, intestinal crypt size remains relatively constant throughout adult life. The proliferation of stem cells toward colonic epithelia linage provides the driving force for cell turnover in the gut and gives rise to an astounding repertoire of approximately 5×10¹⁰ cells in an adult colon. More impressively, the kinetics controlling proliferation, life span, and regulated cell death allows the whole colonic epithelium population to be replenished every 5 days.
Thousands of colonic crypts exist in the colon. These functional units are responsible for the rapid generation of epithelial cells. Stem cells exist at the base of each crypt and proliferate to produce transient amplifying cells. Transient amplifying cells also rapidly proliferate and generate progenitor epithelial cells. Committed epithelial cell precursors differentiate and move upward and out of the crypt to form the luminal surface of the colon. In normal conditions, the intestinal epithelium rapidly regenerates and peacefully co-exists with the microbiome. However, if the renewal process becomes dysregulated manifestations such as cancer, irritable bowel disease (IBD), or impaired epithelial barrier functions lead to chronic illness and higher susceptibility to bacterial infections. A systems biology approach to model epithelial cell proliferation, differentiation, and life span in addition to immune cell interactions at a tissue level provides opportunity to expose non-intuitive mechanisms underlying gastrointestinal diseases and an avenue for novel predictions surrounding the development of host-targeted therapeutics. One area of particular interest is characterizing immune responses during the viscous cycle of malnutrition and intestinal disease. Malnutrition significantly suppresses epithelial barrier integrity enhancing susceptibility to bacterial infections. Enteroaggregative Escherichia coli (EAEC) is an etiologic agent of enterocolitis and persistent diarrhea worldwide, especially in malnourished children. We have demonstrated a potential regulatory role for IL-17 on EAEC disease amelioration in a malnourished mouse model. We believe the IL-17 dependent mechanism promotes an antimicrobial response from epithelial cells to facilitate bacterial clearance.
Modeling Epithelial Cell Responses to EAEC
An ordinary differential equation (ODE) based model has been generated to elucidate kinetics underlying the role of IL17 in mucosal immune responses to EAEC infections. CellDesigner was used to generate an SBML compliant network that was then imported into COPASI for simulations. Steady state epithelial barrier functions in the model, as in nature, are maintained by rapid production of proliferating cells (transient amplifying [TA]) from stem cells. Once committed to epithelial cell lineage [preE], these cells differentiate into mature epithelial cells [E] and experience normal apoptosis rates leading to cell death [deadE] and exfoliation [degradation symbol]. During in silico infection, EAEC induces infection in epithelial cells, promotes cell death, and initiates rapid proliferation of TA cells. Infected epithelial cells trigger the production of IL17. IL17 production is generally represented to encompass levels from various cells including Th17 and TCRγδ T cells. Antimicrobial peptide secretion (AMP) from epithelial cells becomes upregulated when IL17 levels increase facilitating EAEC death and bacterial clearance. A time course simulation (infection at time = 0) demonstrates peak infection around day 5 post infection mimicking in vivo observations.
Epithelial cell turnover is illustrated beginning with stem cells and concluding with dead cell exfoliation. IL17 production and signaling are activated upon infection with Enteroaggregative E. coli. IL17 promotes antimicrobial peptide production from epithelial cells to potentiate bacterial clearance. The network is provided in Systems Biology Markup Language-compliant format.
EAEC infection is introduced to a population of epithelial cells at time zero. Cell proliferation slightly increases while epithelial cells convert to an infected state. A peak of infection occurs at day 5 whereupon the number of infected cells rapidly decreases and the epithelial cell population returns to a normal steady state. The following is a list of archived EAEC Epithelial Cell computational model releases. Please click on individual releases for more details.
- First, the latest, release on May 22nd, 2013
The primary MIEP team member responsible for maintaining this model is Cassandra Philipson at the Virginia Bioinformatics Institute. Please contact her with any questions or comments. For the latest release, the model is available for download in CellDesigner xml format. We have tested that the model is compatible with Cell Designer 4.2. The following is the structure figure of the model, and by clicking on the figure you can navigate the model through a Google-Map-API-enabled CellPublisher user friendly interface.
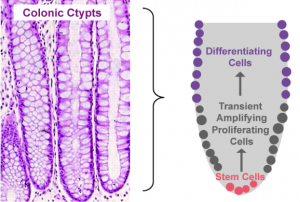 Figure 2. Pictorial depiction of colonic epithelial cell turnover
 Figure 3. Epithelial cell model network
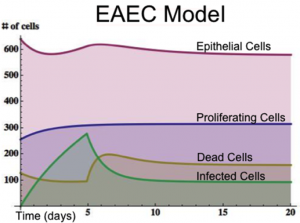 Figure 4. Time course infection simulation
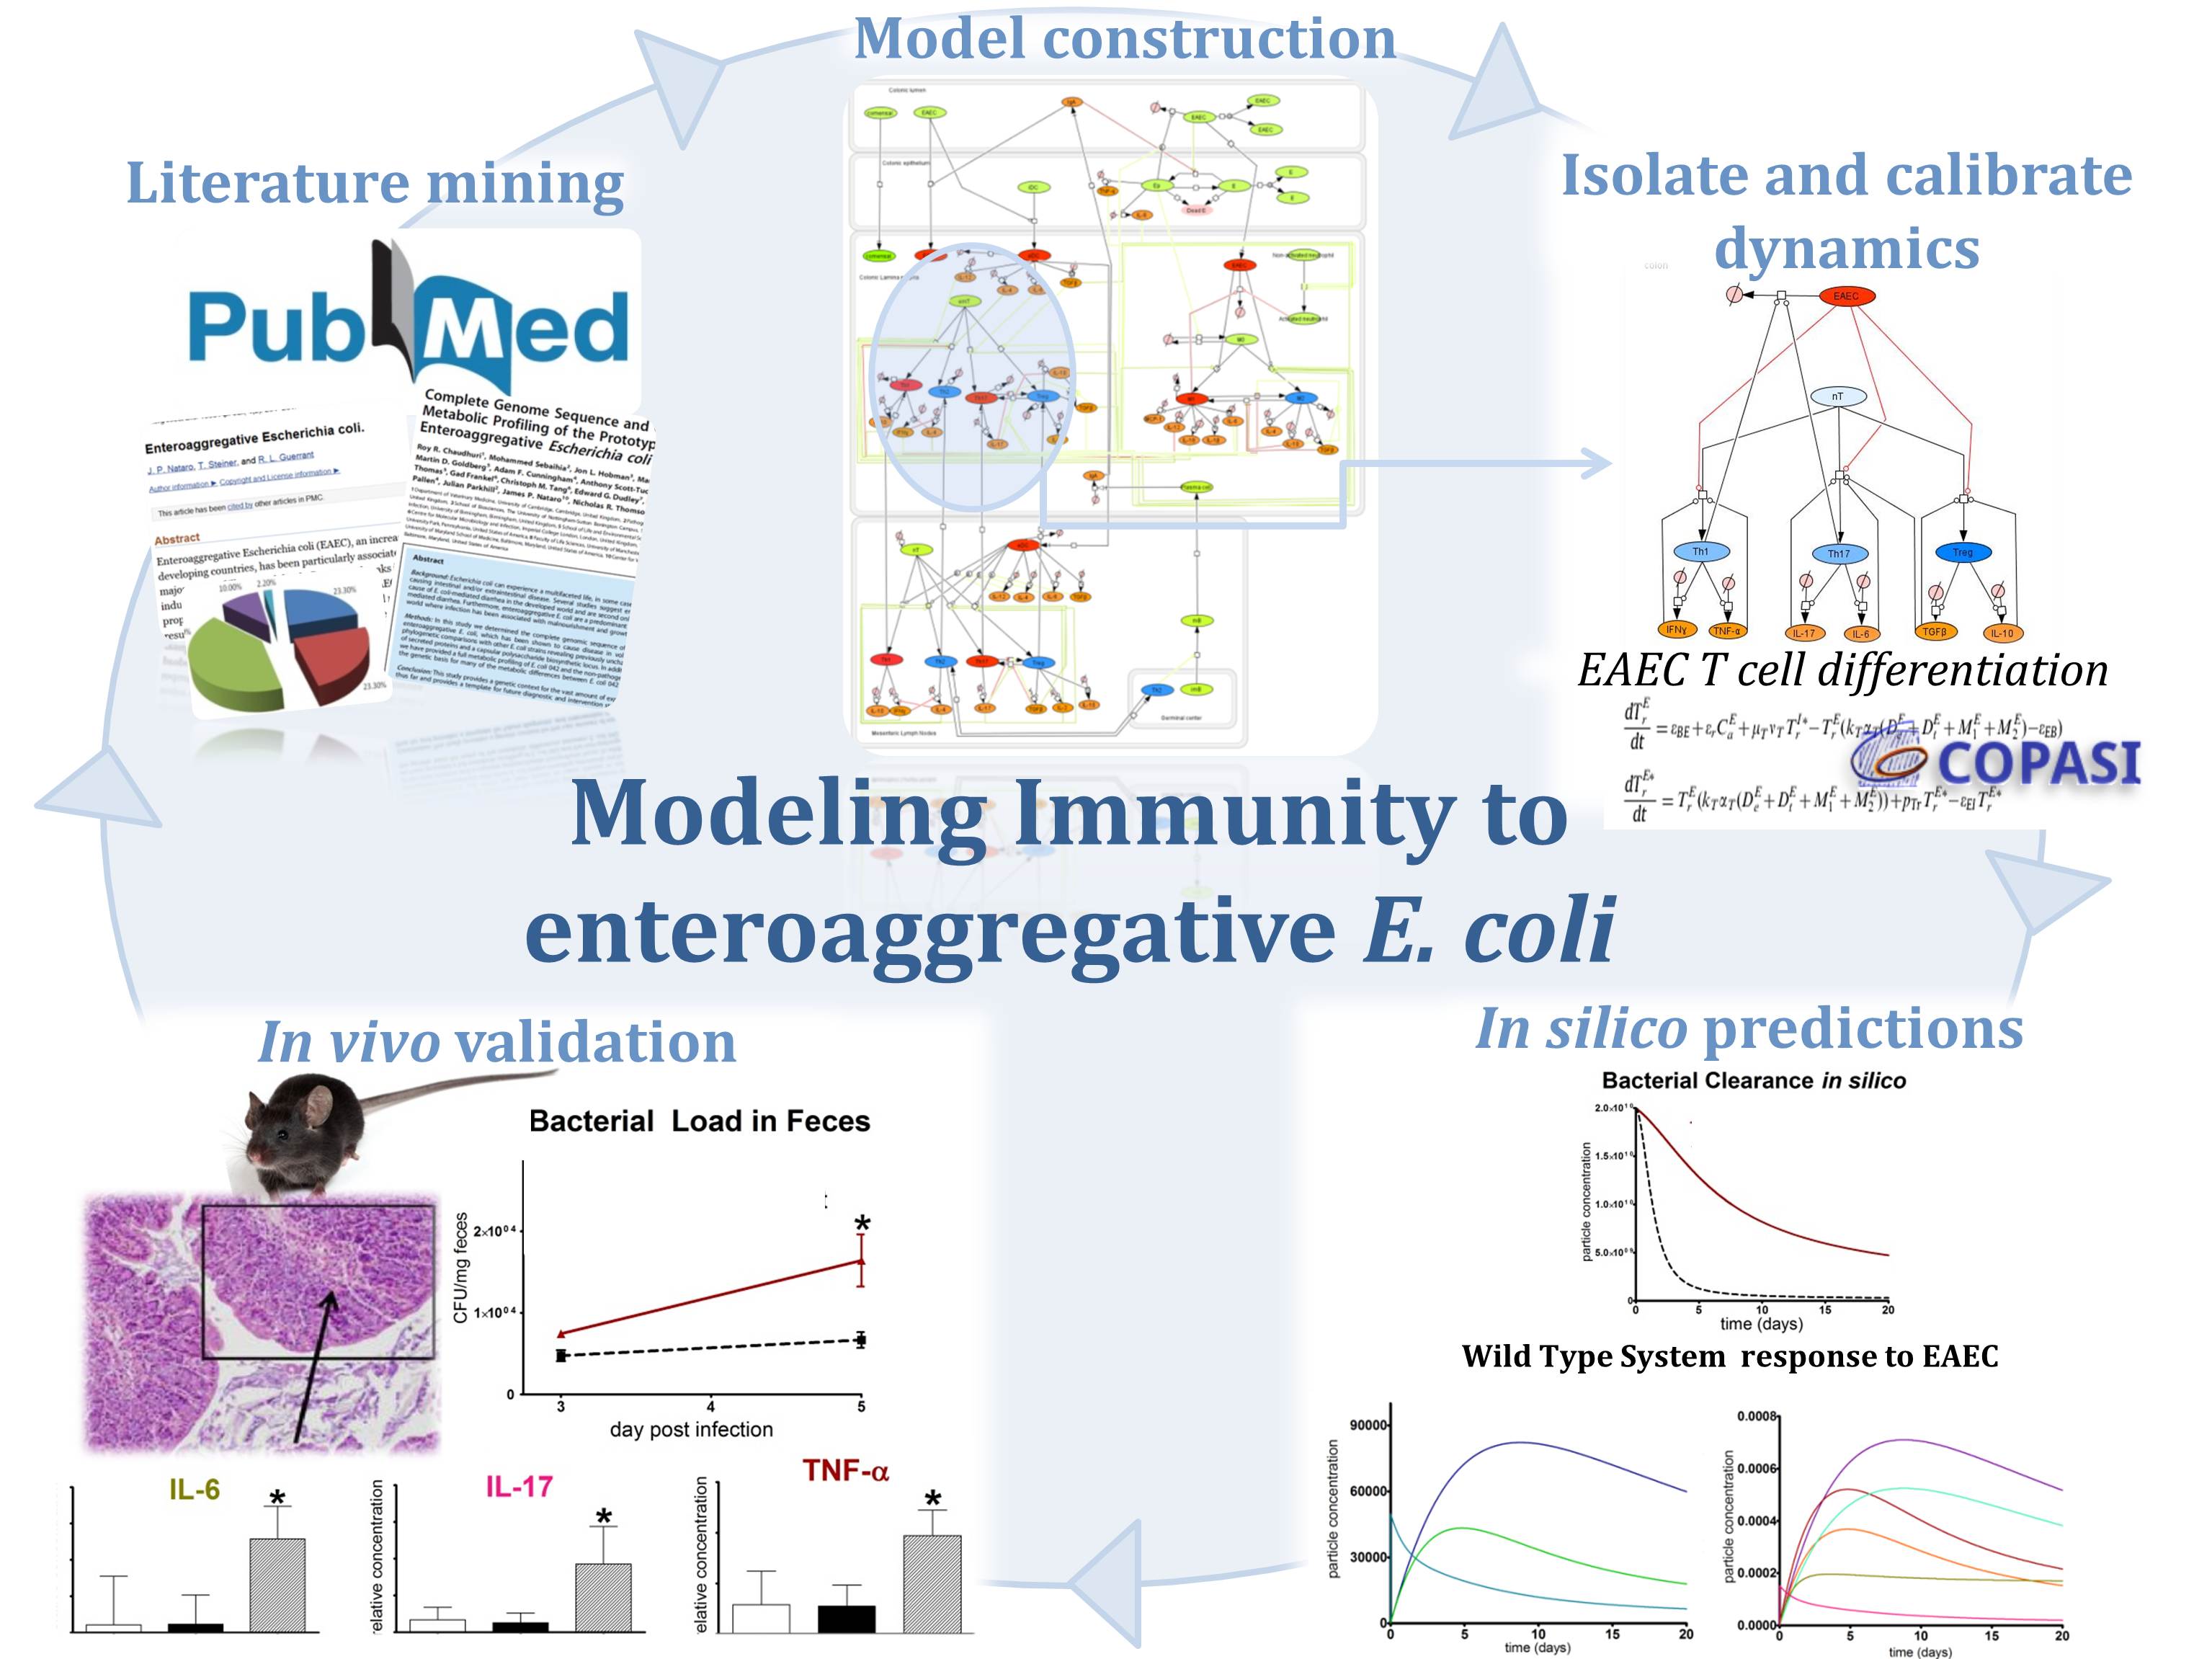 Figure 1. Modeling Immunity to enteroaggregative E. coli
Highlights
- EAEC is a leading cause of intestinal inflammation and persistent diarrhea worldwide, especially in children and malnourished individuals.
- Immune responses toward EAEC are poorly characterized causing limited medical advances for safe and effective treatments.
- NIMML combines experimental and computational approaches to study how novel drug candidates and nutritional interventions, like protein and zinc supplementation, can promote host immunity and defense against EAEC infection.
Background and Epidemiology
Enteroaggregative E. coli (EAEC) is an etiologic agent of enterocolitis and severe persistent diarrhea worldwide, especially in malnourished children and immunosuppressed individuals. While many E. coli strains co-exist in the gastrointestinal tract as harmless commensal symbionts, disease-causing pathogenic E. coli strains have the ability to induce life-threatening illnesses that often require hospitalization and can result in death. EAEC is one of six pathotypes known to induce intestinal disease and persistent diarrhea. Epidemiologic studies reveal EAEC as the single most common cause of bacteria-induced diarrhea among all age groups in the United States [1]. EAEC also ranks as the second most common cause of traveler’s diarrhea [2]. Both developing and industrialized countries are susceptible to experiencing large EAEC-induced diarrheal outbreaks presenting significant public health concerns [3]. The recent German outbreak in May 2011 caused by shiga toxin producing EAEC strain O104:H4 resulted in the highest frequency of EAEC-induced deaths ever recorded [4].
Pathogenesis
EAEC pathogenesis has been summarized into three primary stages:
- Abundant adherence to the intestinal mucosa
- Biofilm formation over enterocyte surface
- Release of toxins, induction of proinflammatory response, mucosal toxicity, and enhanced intestinal secretion [3,5]
Several well defined virulence factors exist in the EAEC genome however the complete understanding of pathogenesis remains unknown. A few virulence factors are briefly described below:
- Aggregative adherence fimbria (AAF) mediate the adhesion of EAEC to the intestinal mucosa favoring the formation of the thick biofilm. At least four distinct AAF alleles have been described and are known to contribute to the inflammatory response of epithelial cells infected with EAEC [6].
- Dispersin is an EAEC-secreted protein necessary for the proper extension of AAF [7].
- Pic is a serine autotransporter with mucinolytic properties allowing EAEC to penetrate the mucus layer of the intestine and induce mucin hypersecretion [8].
- Pet protein is an enterotoxin that causes severe damage to epithelial cells by cleaving cytoskeleton proteins within the microvilli [9].
- Heat-stable enterotoxin-1 (EAST1) secreted by EAEC may promote the initial phase of watery diarrhea by enhancing intracellular levels of cGMP and inhibiting the Na/Cl transport system [10].
The exceptionally virulent shiga toxin-producing EAEC strain O104:H4 illuminates how plasmid-encoded virulence factors can be gained suggesting that that the EAEC archetype is not as fixed as once believed [11].
Host Response to EAEC
EAEC flagellin are known to mediate the activation of inflammatory pathways in epithelial cells through toll-like receptor signaling resulting in proinflammatory cytokine production. IL-8 is a hallmark cytokine produced by epithelial cells during EAEC infection that promotes neutrophil recruitment and transmigration [12]. Recently the MIEP team has discovered the importance of Th17 cells in host responses to EAEC facilitating bacterial clearance. We modulated mucosal inflammation through pharmacological and genetic ablation of transcription factor PPARg in malnourished hosts. Loss of PPARg functionality promoted a beneficial proinflammatory response generating a cytokine environment prone to Th17 cell differentiation and recruitment that lead to disease amelioration. Cellular responses in EAEC-infected PPARg deficient mice were accompanied by enhanced antimicrobial peptide production likely mediated by an IL-17 dependent mechanism. Additional studies are geared toward understanding how EAEC induces these responses.
Animal models of EAEC infection
A high demand exists for a reproducible and comprehensive animal model of EAEC infection to elucidate novel mechanisms of host-EAEC interactions. Currently, four primary animal models exit:
- Gnotobiotic piglet model [13]
- Neonatal and weaned C57BL/6 mice with or without malnutrition [14]
- Antibiotic treatment in combination with infection in adult BALB/c mice [15]
- Immunodeficient mice with human intestinal xenograph implantation [16]
These models have provided insight related to EAEC pathogenesis however they are highly limited in their ability to characterize immunological responses to EAEC at the intestinal mucosa. There is still a desperate need for the development of an animal model that reproduces significant symptoms of EAEC-induced pathology.
Modeling Immunity to EAEC
MIEP specifically focuses on characterizing the mechanisms underlying EAEC infection by integrating computational and mathematical modeling approaches with mouse challenge studies to identify novel biomarkers and discover unforeseen therapeutic targets. Ultimately, MIEP projects aim to develop modeling aided, broad-based, host-targeted immune therapeutics that will protect against EAEC-induced mucosal damage and persistent diarrhea. Currently our projects focus on prototype strains 042 and JM221. In October 2012 we released the first version of the EAEC T cell differentiation model. This model is an oversimplified depiction of EAEC infection, antigen presentation, and the host’s adaptive immune response to pathogen. We calibrated the model using in house gene expression and flow cytometry data from malnourished EAEC strain JM221 infected mice. The goal of the simplified EAEC model is to capture and quantify the dynamics of interest surrounding EAEC-host interaction; specifically T cell responses and their contributory effects on bacterial clearance. Currently the model effectively predicts the beneficial role of an early proinflammatory and Th17 response in disease amelioration through EAEC clearance by day 5. Additionally, the model is successful in matching the assay-based measurements from in vivo experiments during simulations. As more data is generated through validation studies, the model will be refined and built up to encapsulate additional cell types and more complex molecular pathways. In doing so, we aim to predict non-intuitive physics underlying host-EAEC interactions in a holistic manner.
References
1. Nataro JP, Mai V, Johnson J, Blackwelder WC, Heimer R, et al. (2006) Diarrheagenic Escherichia coli infection in Baltimore, Maryland, and New Haven, Connecticut. Clin Infect Dis 43: 402-407.
2. Taylor DN, Bourgeois AL, Ericsson CD, Steffen R, Jiang ZD, et al. (2006) A randomized, double-blind, multicenter study of rifaximin compared with placebo and with ciprofloxacin in the treatment of travelers’ diarrhea. Am J Trop Med Hyg 74: 1060-1066.
3. Huang DB, Mohanty A, DuPont HL, Okhuysen PC, Chiang T (2006) A review of an emerging enteric pathogen: enteroaggregative Escherichia coli. J Med Microbiol 55: 1303-1311.
4. Al Safadi R, Abu-Ali GS, Sloup RE, Rudrik JT, Waters CM, et al. (2012) Correlation between in vivo biofilm formation and virulence gene expression in Escherichia coli O104:H4. PLoS One 7: e41628.
5. Nataro JP (2005) Enteroaggregative Escherichia coli pathogenesis. Curr Opin Gastroenterol 21: 4-8.
6. Harrington SM, Strauman MC, Abe CM, Nataro JP (2005) Aggregative adherence fimbriae contribute to the inflammatory response of epithelial cells infected with enteroaggregative Escherichia coli. Cell Microbiol 7: 1565-1578.
7. Sheikh J, Czeczulin JR, Harrington S, Hicks S, Henderson IR, et al. (2002) A novel dispersin protein in enteroaggregative Escherichia coli. J Clin Invest 110: 1329-1337.
8. Navarro-Garcia F, Gutierrez-Jimenez J, Garcia-Tovar C, Castro LA, Salazar-Gonzalez H, et al. (2010) Pic, an autotransporter protein secreted by different pathogens in the Enterobacteriaceae family, is a potent mucus secretagogue. Infect Immun 78: 4101-4109.
9. Canizalez-Roman A, Navarro-Garcia F (2003) Fodrin CaM-binding domain cleavage by Pet from enteroaggregative Escherichia coli leads to actin cytoskeletal disruption. Mol Microbiol 48: 947-958.
10. Telli M, Guiral E, Martinez JA, Almela M, Bosch J, et al. (2010) Prevalence of enterotoxins among Escherichia coli isolates causing bacteraemia. FEMS Microbiol Lett 306: 117-121.
11. Mellmann A, Harmsen D, Cummings CA, Zentz EB, Leopold SR, et al. (2011) Prospective genomic characterization of the German enterohemorrhagic Escherichia coli O104:H4 outbreak by rapid next generation sequencing technology. PLoS One 6: e22751.
12. Khan MA, Kang J, Steiner TS (2004) Enteroaggregative Escherichia coli flagellin-induced interleukin-8 secretion requires Toll-like receptor 5-dependent p38 MAP kinase activation. Immunology 112: 651-660.
13. Tzipori S, Montanaro J, Robins-Browne RM, Vial P, Gibson R, et al. (1992) Studies with enteroaggregative Escherichia coli in the gnotobiotic piglet gastroenteritis model. Infect Immun 60: 5302-5306.
14. Roche JK, Cabel A, Sevilleja J, Nataro J, Guerrant RL (2010) Enteroaggregative Escherichia coli (EAEC) impairs growth while malnutrition worsens EAEC infection: a novel murine model of the infection malnutrition cycle. J Infect Dis 202: 506-514.
15. Harrington SM, Sheikh J, Henderson IR, Ruiz-Perez F, Cohen PS, et al. (2009) The Pic protease of enteroaggregative Escherichia coli promotes intestinal colonization and growth in the presence of mucin. Infect Immun 77: 2465-2473.
16. Boll EJ, Struve C, Sander A, Demma Z, Nataro JP, et al. (2012) The Fimbriae of Enteroaggregative Escherichia coli Induce Epithelial Inflammation In Vitro and in a Human Intestinal Xenograft Model. J Infect Dis 206: 714-722.
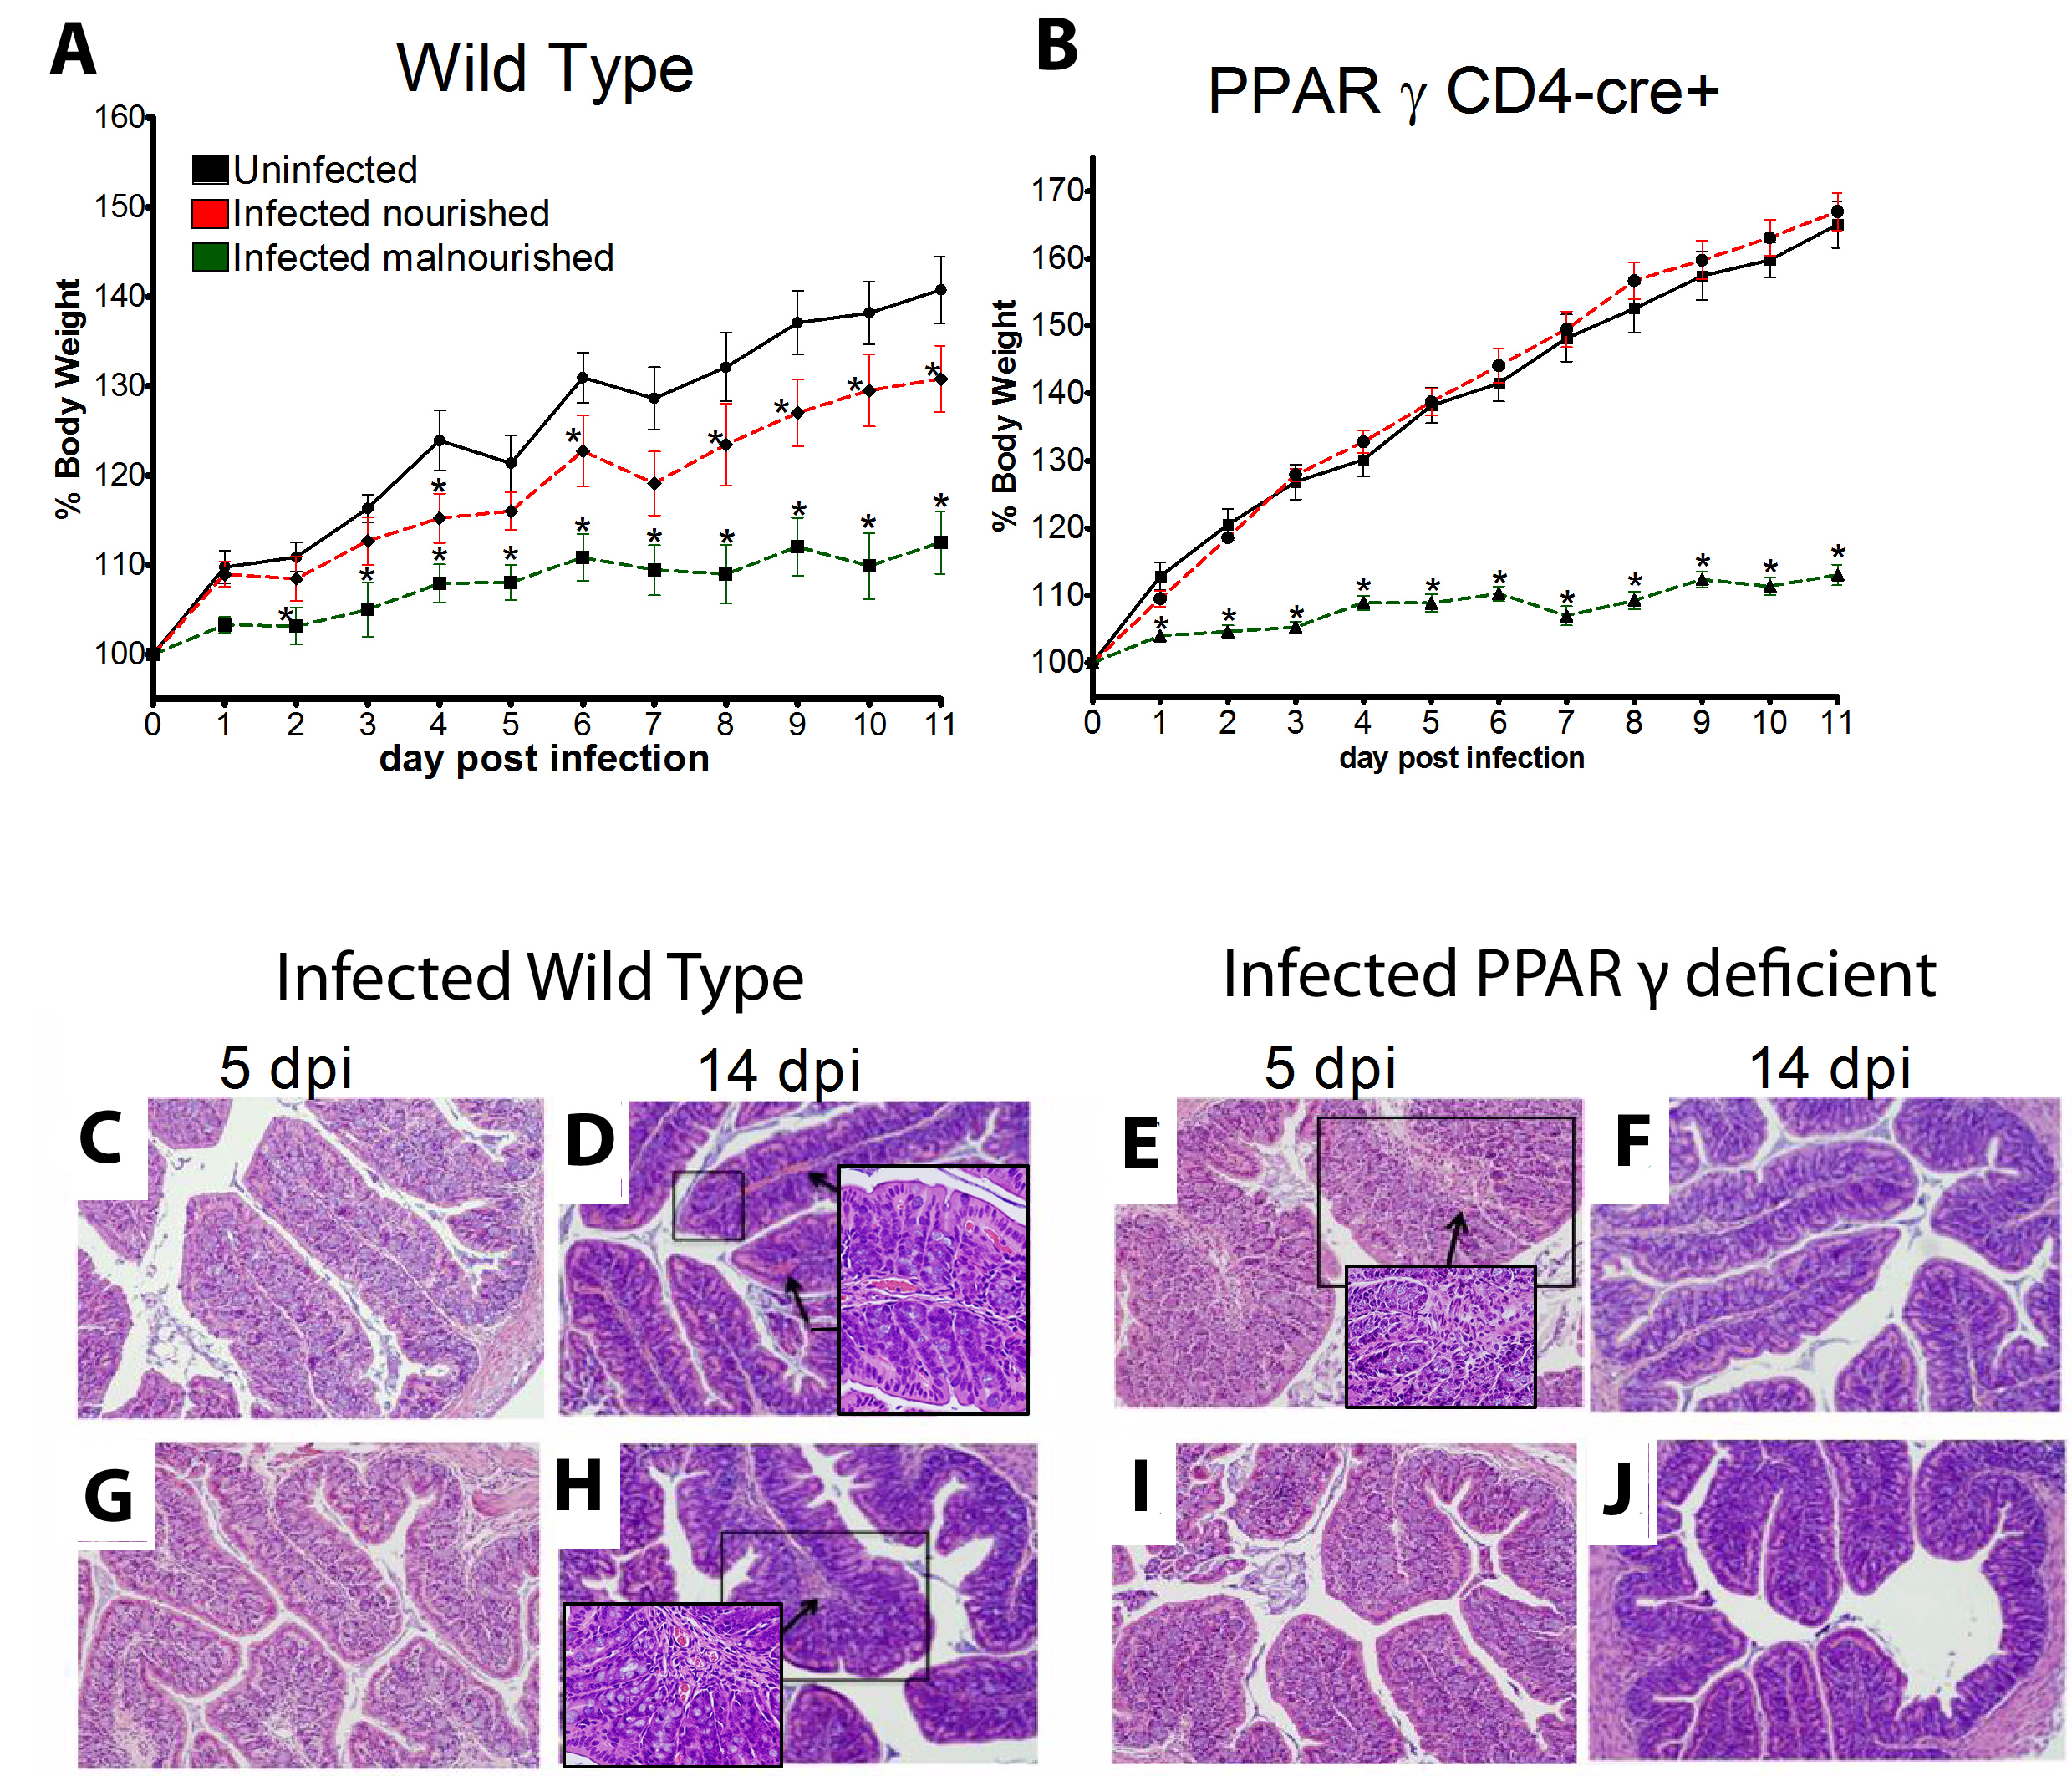 Figure 1. The loss of PPAR γ in T cells diminishes growth retardation during EAEC infection.
Highlights
- Malnutrition causes significant impairments in cell-mediated immunity and remains the most common cause of immunodeficiency worldwide.
- Our studies explain mechanisms whereby malnutrition alters host responses to EAEC. Specifically, we have investigated how protein and zinc deficiencies result in chronic EAEC burden due to insufficient innate and adaptive immune responses.
- Our current publications demonstrate novel therapeutic interventions for treating EAEC infection. We have shown that mice can be rescued from EAEC infection when mucosal inflammation and immunity is modulated by nutrient supplementation or pharmacologically targeting host transcription factors.
- All of our published data can be accessed through the EAEC data porthole on this website.
Abstract
The Role of Peroxisome Prolifertor-Activated Receptor γ in Immune Responses to Enteroaggregative Escherichia coli Infection
Background
Enteroaggregative Escherichia coli (EAEC) is recognized as an emerging cause of persistent diarrhea and enteric disease worldwide. Mucosal immunity towards EAEC infections is incompletely understood due in part to the lack of appropriate animal models. This study presents a new mouse model and investigates the role of peroxisome proliferator-activated receptor gamma (PPARγ) in the modulation of host responses to EAEC in nourished and malnourished mice.
Methods/Principal Findings
Wild-type and T cell-specific PPARγ null C57BL/6 mice were fed protein-deficient diets at weaning and challenged with 5×10⁹cfu EAEC strain JM221 to measure colonic gene expression and immune responses to EAEC. Antigen-specific responses to E. coli antigens were measured in nourished and malnourished mice following infection and demonstrated the immunosuppressive effects of malnutrition at the cellular level. At the molecular level, both pharmacological blockade and deletion of PPARγ in T cells resulted in upregulation of TGF-β, IL-6, IL-17 and anti-microbial peptides, enhanced Th17 responses, fewer colonic lesions, faster clearance of EAEC, and improved recovery. The beneficial effects of PPARγ blockade on weight loss and EAEC clearance were abrogated by neutralizing IL-17 in vivo.
Conclusions
Our studies provide in vivo evidence supporting the beneficial role of mucosal innate and effector T cell responses on EAEC burden and suggest pharmacological blockade of PPAR as a novel therapeutic intervention for EAEC infection.
Summary
Malnourished hosts have weakened immune responses accompanied by persistent infection. Malnutrition causes significant impairments in cell-mediated immunity and remains the most common cause of immunodeficiency worldwide. Our studies clearly portray that malnourished hosts cannot generate necessary mucosal defense mechanisms to combat against EAEC infection which results in chronic pathological burden. Due to protein deficiency, malnourished wild type mice do not mount sufficient innate and adaptive immune response but instead experience chronic EAEC infection characterized by growth shortfalls, histopathological burden, and suppressed proinflammatory and antimicrobial responses resulting in persistent EAEC shedding in feces (Figure 1). In order to modulate mucosal inflammation and immunity in malnourished hosts during EAEC infection we targeted peroxisome proliferator activated receptor (PPAR) γ pharmacologically and genetically to evaluate disease outcomes.
Inhibiting PPAR γ function potentiates beneficial effector and antimicrobial responses that facilitate bacterial clearance. Mice lacking PPAR γ functionality experienced enhanced mucosal responses beginning as soon as 3 days post infection that ultimately restored growth rates, facilitated bacterial clearance, and enabled disease amelioration. Early during infection innate proinflammatory cytokine and chemokine expression of TNF-α, IL-6, IL-1β, MCP-1, CCL20, and CXCL1 was significantly upregulated in colonic tissue of PPAR γ deficient hosts. Improved proinflammatory responses were accompanied by potent antimicrobial peptide production and accelerated bacterial clearance (Figure 2).
EAEC burden in colon was assessed by quantitative real time RT-PCR using bacterial DNA isolated from feces of infected mice (A). Gene expression data from colonic tissue of malnourished wild type mice was also analyzed using quantitative real-time RT-PCR five days post infection and reported as values normalized to β-actin (B-G). Data are represented as mean ± standard error. Asterisks indicate values where differences are statistically significant (P
<0.05).
Beneficial effects of PPAR γ blockade are likely mediated through an IL-17 dependent mechanism. Elevated percentages of colonic lamina propria CD4+ T cells secreting IL-17 or heightened and simultaneous expression of colonic IL-6, TGF-β, and IL-17 were detected in mice lacking PPAR γ compared to wild type counterparts illuminating a key role for Th17 cells during EAEC infection. Studies portrayed that simultaneous treatment with anti-IL-17A and a PPAR γ antagonist (GW9662) abrogated the beneficial effects of PPAR γ blockade alone. Specifically, neutralizing IL-17A and inhibiting PPAR γ functionality together resulted in significant growth retardation correlated to persistent bacterial burden that resembled patterns observed in untreated mice (Figure 3).
Growth retardation in infected wild type mice is expressed as percent growth from day 0 after challenge (A). Enteroaggregative Escherichia coli (EAEC) burden in the colon was assessed by quantitative real time RT-PCR using bacterial DNA isolated from feces of infected mice treated with 1 µM PPARγ antagonist GW9662 (n = 3), 50 µg anti-IL17 and 1 µM GW9662 combined (n = 3) or untreated (n = 3). Asterisks indicate values where differences are statistically significant (p
<0.05), NS signifies no significant difference, and bars are present to indicate significance between groups.
In conclusion, we reported for the first time the importance of Th17 responses in clearing EAEC infections. PPAR γ blockade significantly enhanced lymphoproliferative recall responses, upregulated expression of IL-17, anti-microbial peptides, and inflammatory cytokines at the colonic mucosa, and decreased EAEC fecal shedding. Thus, PPAR γ antagonism represents a novel host-targeted therapeutic approach for EAEC infections.
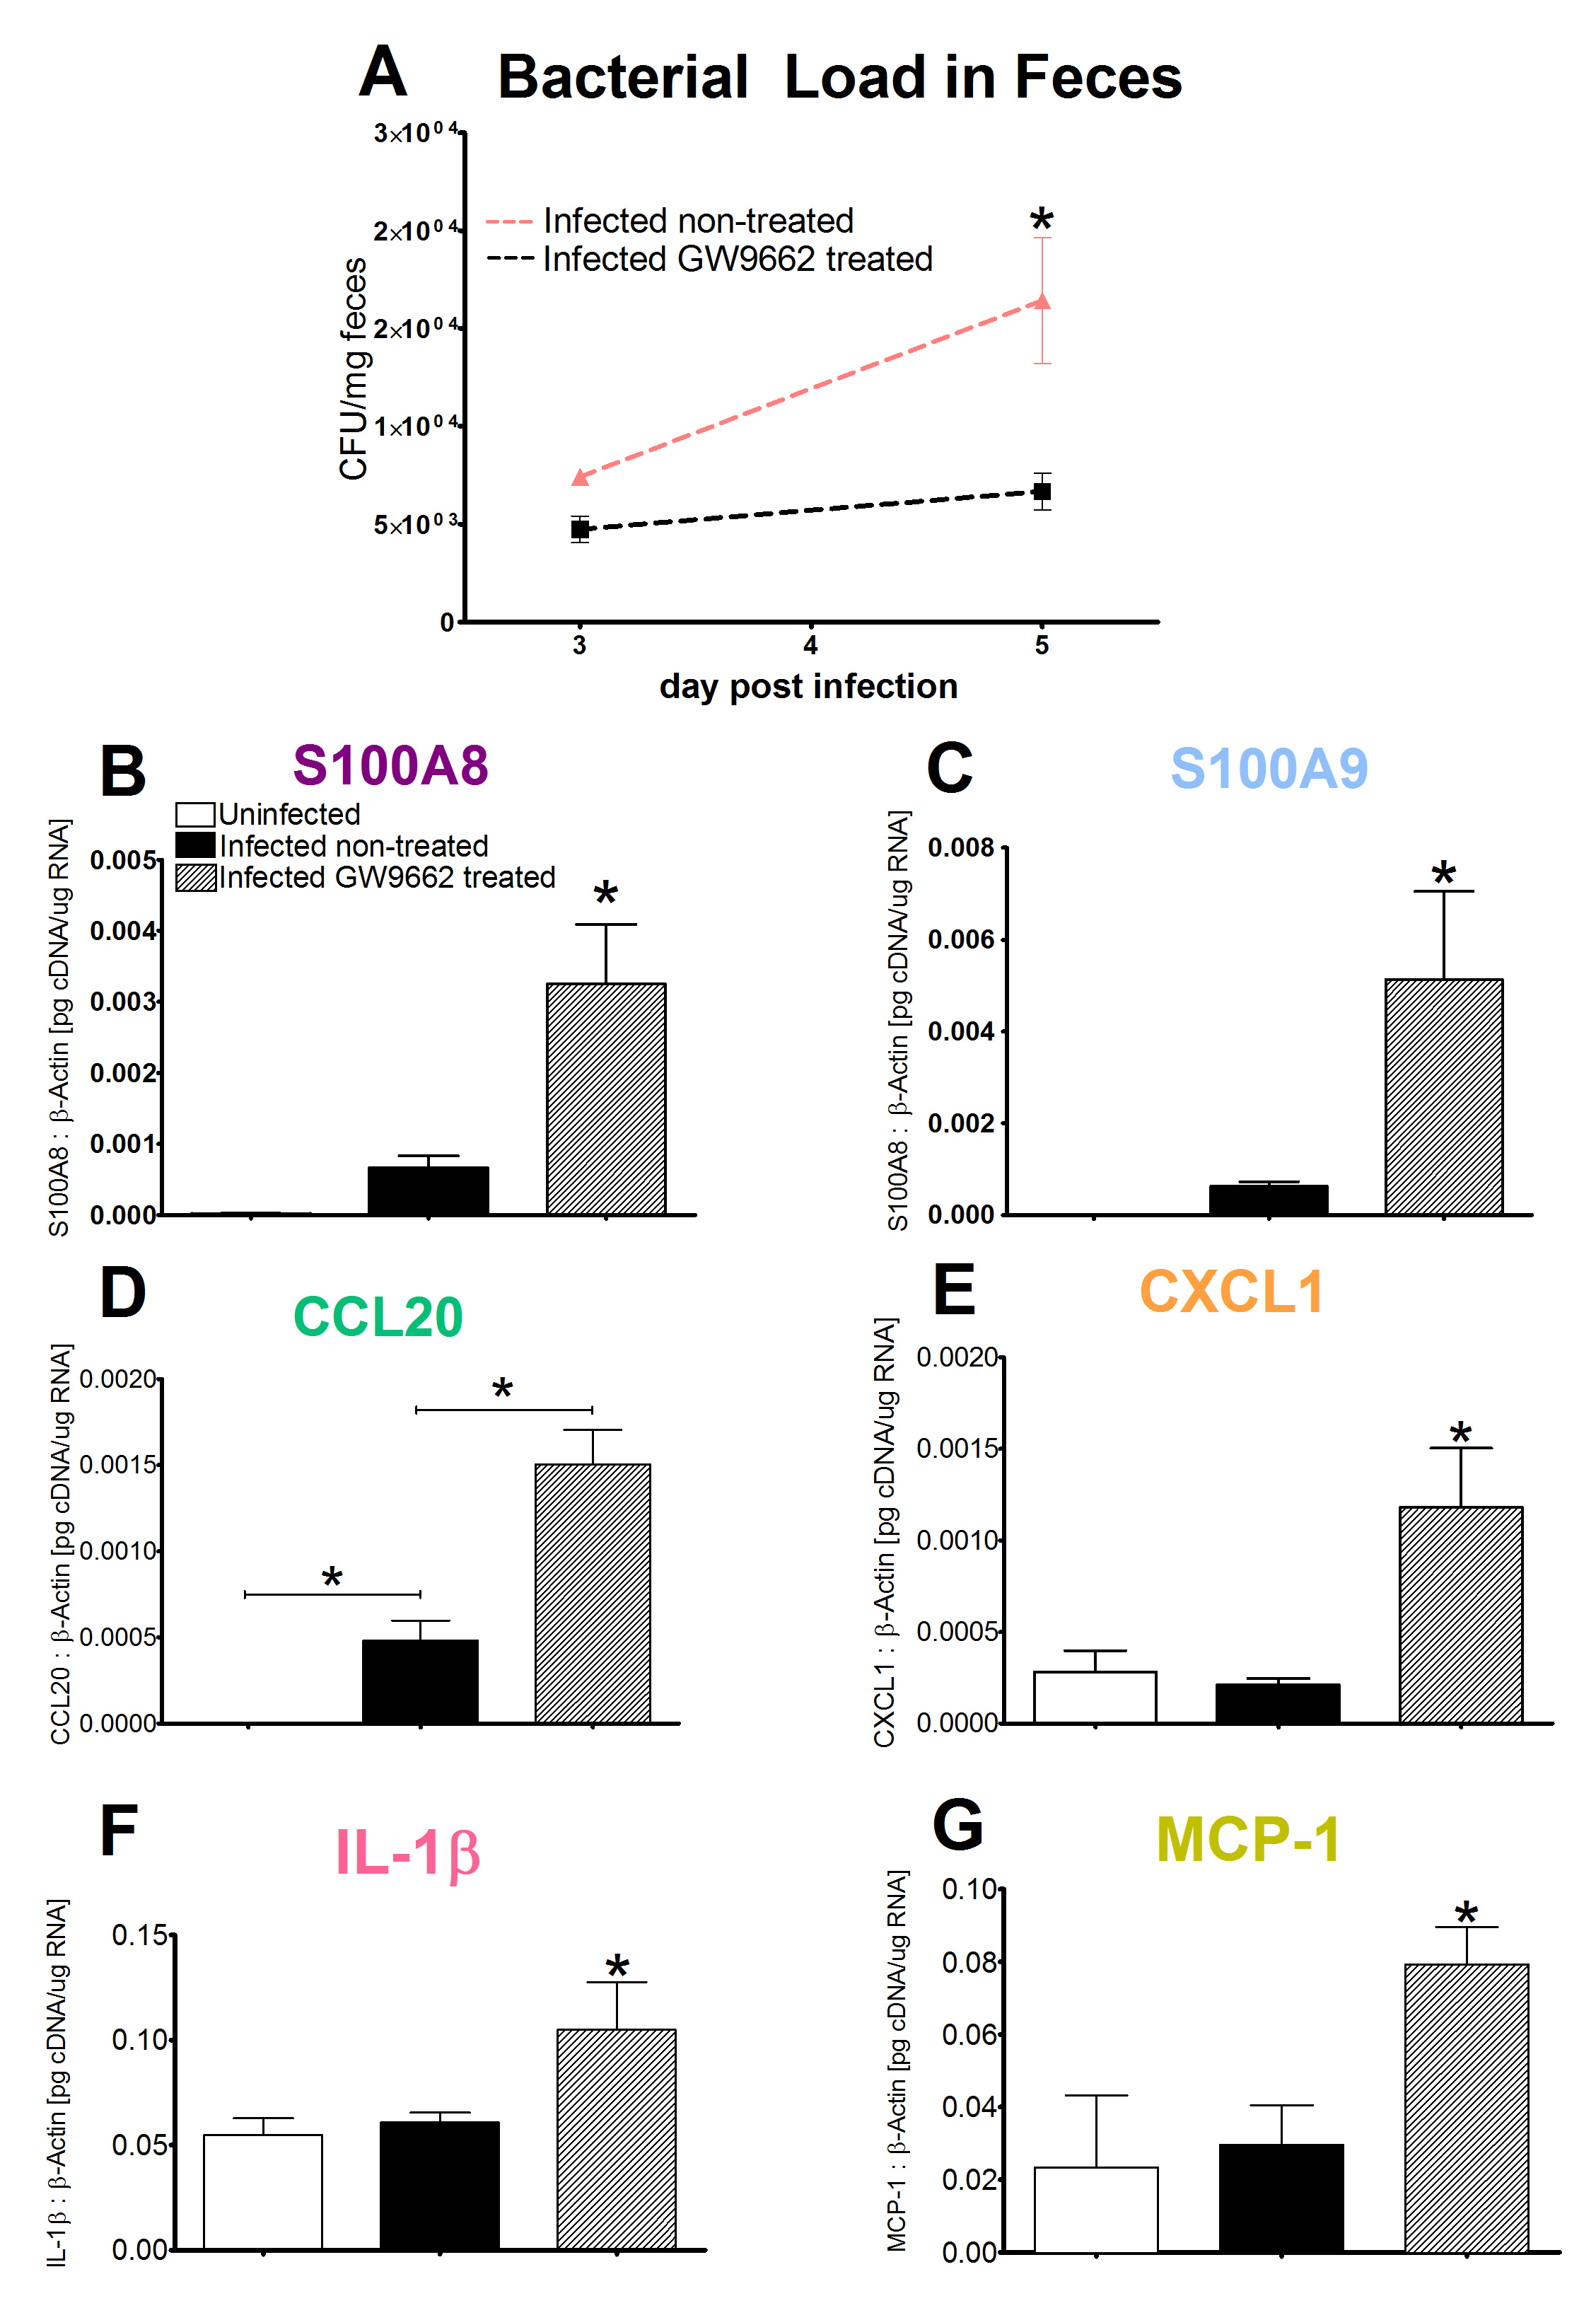 Figure 2. Enhanced proinflammatory gene expression five days post infection correlates to bacterial clearance following PPAR γ blockade.
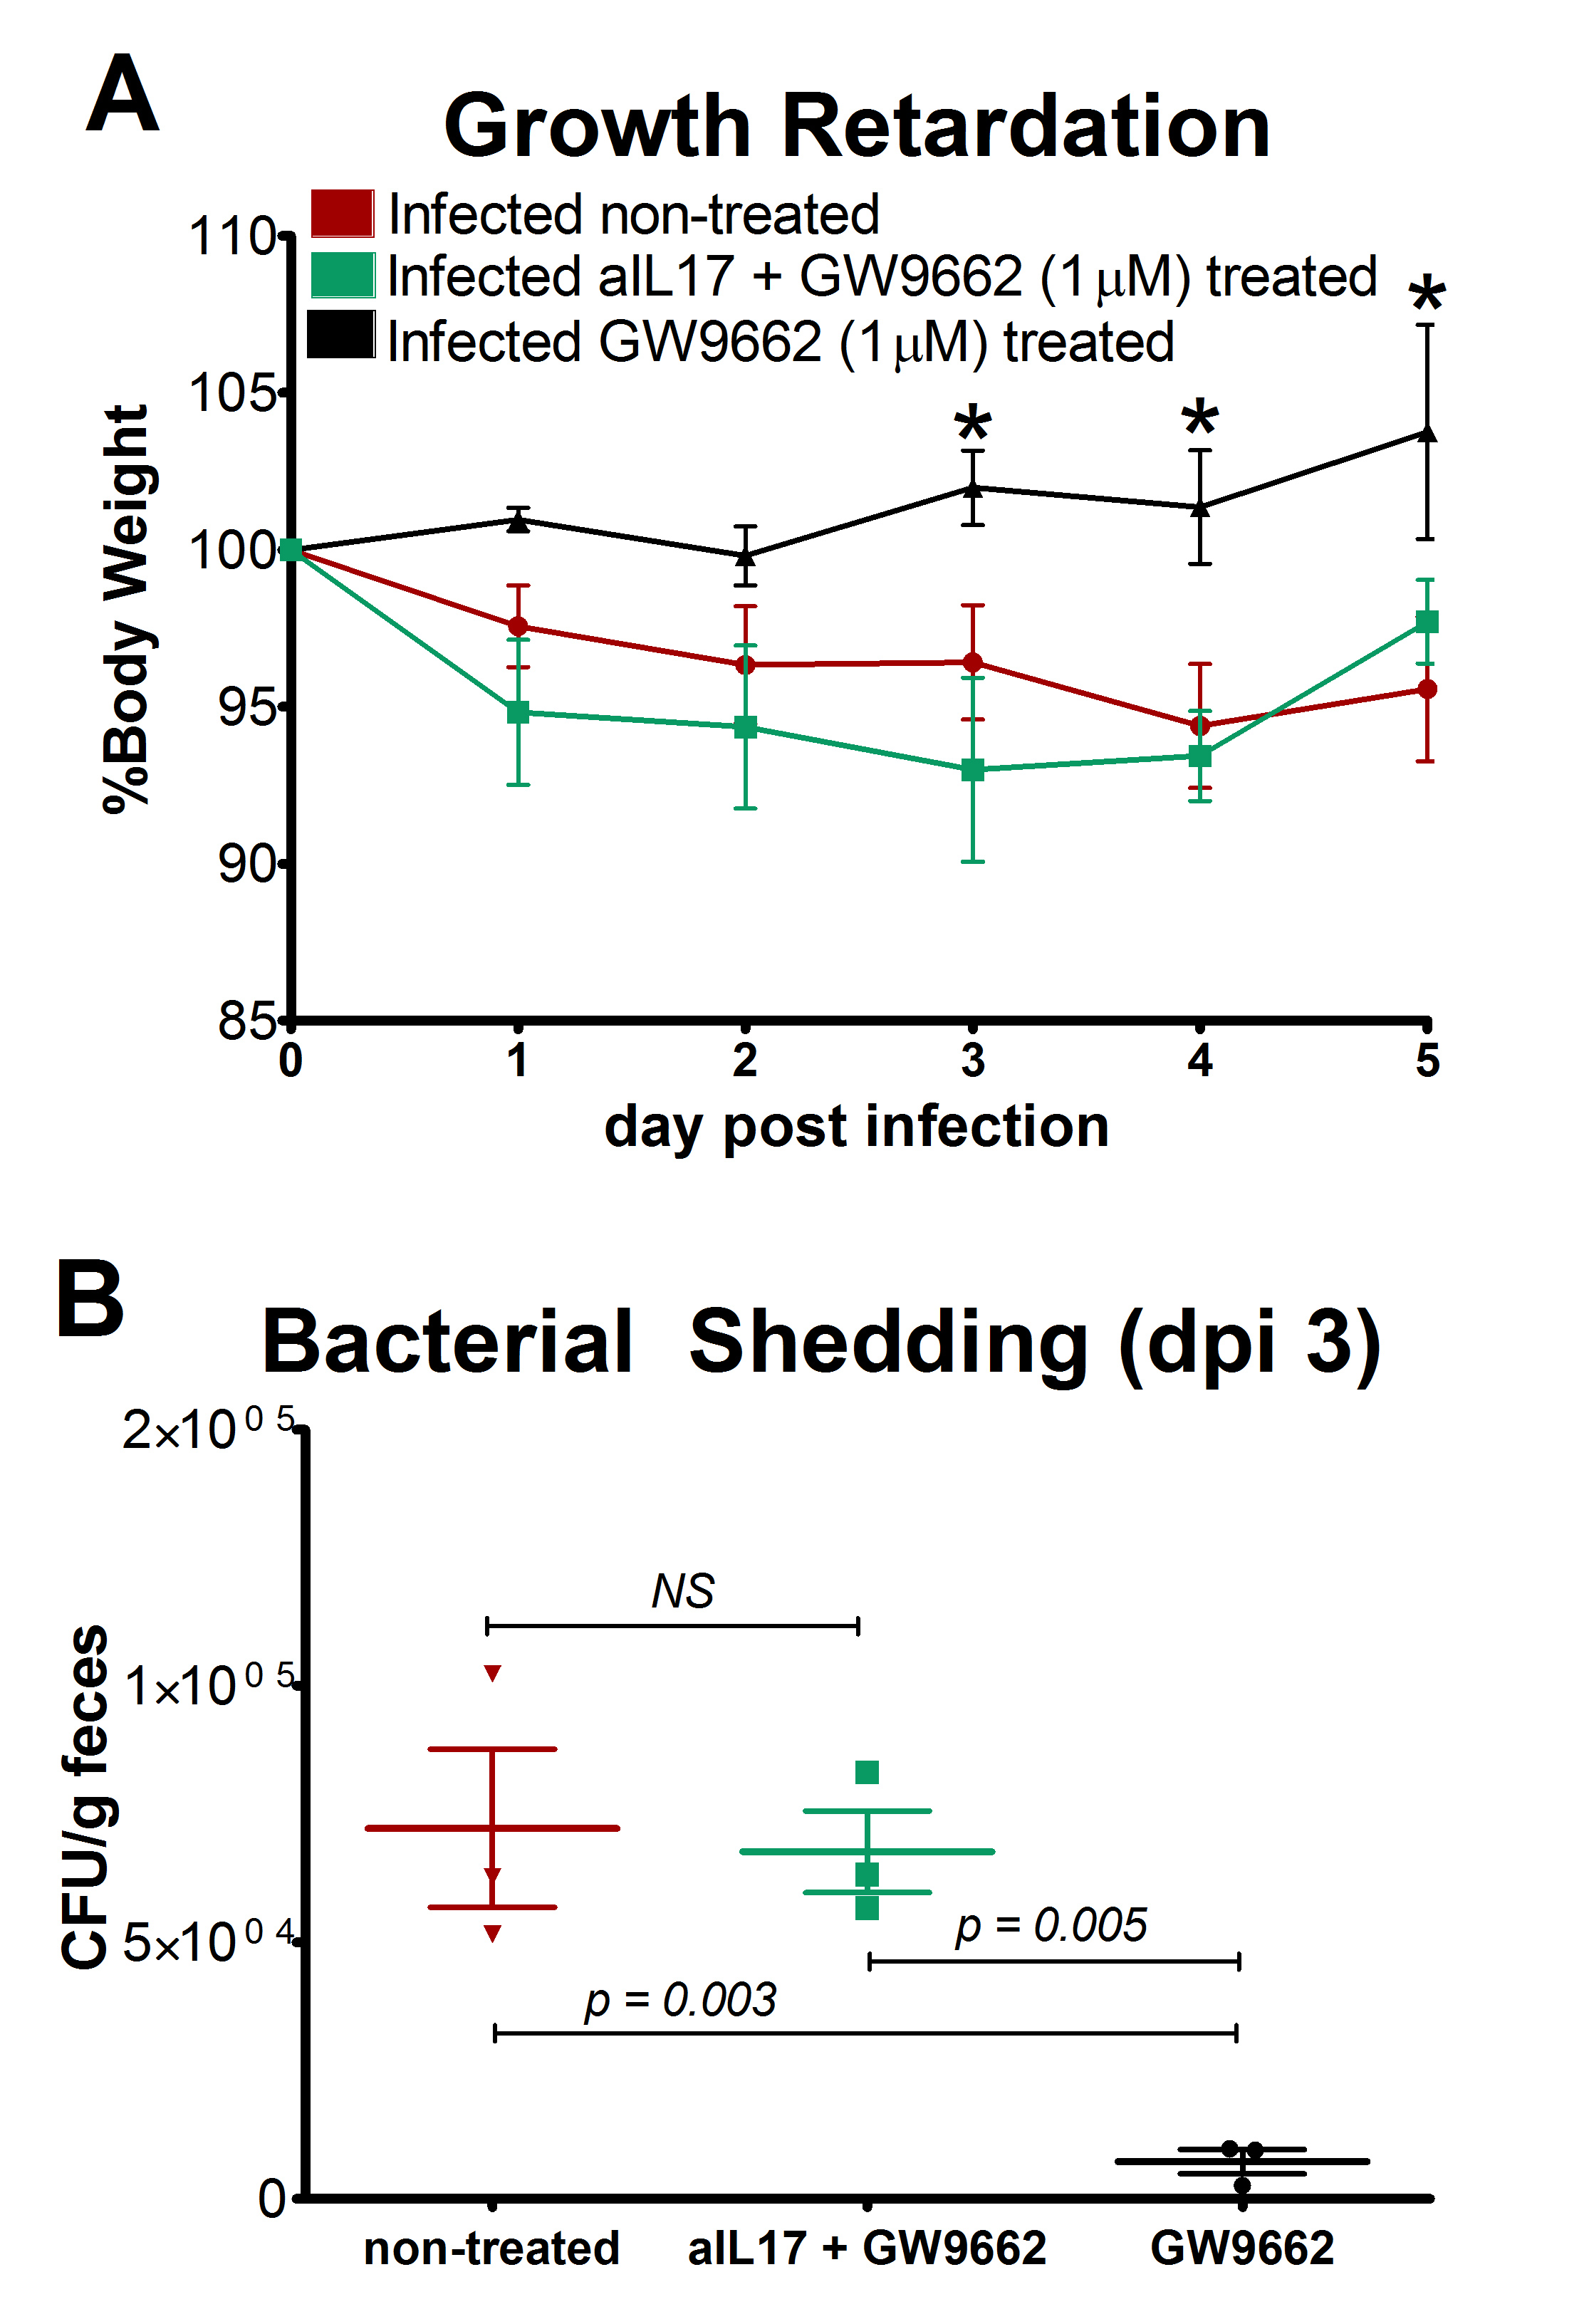 Figure 3. Neutralization of IL-17 abrogates the beneficial effects of GW9662 on weight loss and bacterial burden.
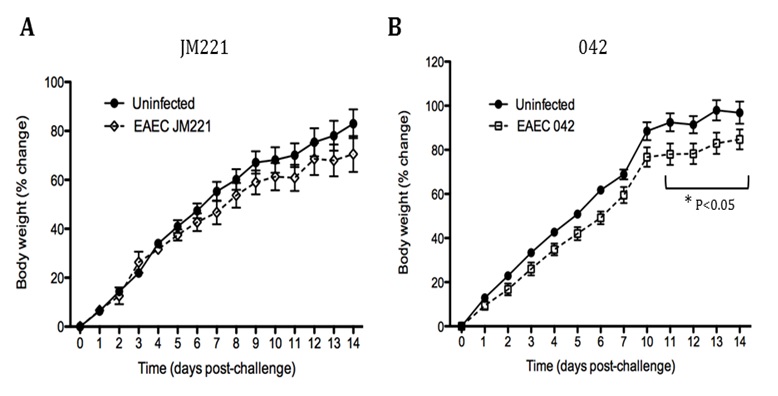 Figure 1. Growth rate of weaned, nourished mice challenged with strains of enteroaggregative Escherichia coli (EAEC) derived from humans.
Abstract
Enteroaggregative Escherichia coli (EAEC) Strain in a Novel Weaned Mouse Model: Exacerbation by Malnutrition, Biofilm as a Virulence Factor, and Treatment by Nitazoxanide
Background Enteroaggregative Escherichia coli (EAEC) is increasingly recognized as a common cause of diarrhea in healthy, malnourished, and immune-deficient adults and children. There is no reproducible non-neonatal animal model for longitudinal studies of disease mechanism or therapy.
Methods Using two strains of human-derived EAEC to challenge weaned C57BL/6 mice, we explored an in vivo model in mice of EAEC infection, in which disease was monitored quantitatively as growth rate, stool shedding, and tissue burden of organisms; nutritional status was varied; and a new class of therapeutics was assessed.
Results A single oral challenge of enteroaggregative E. coli (EAEC) strain 042 resulted in significant growth shortfalls (5-8 % of body weight in 12 days), persistent shedding of microorganisms in stool (>103.2 cfu/10mg of stool for 2+ weeks), and intestinal tissue burden (~103 cfu/10mg of tissue detectable up to 14 days post-challenge). Moderate malnourishment of mice using a ‘regional basic diet’, containing 7% protein and reduced fat and micronutrients, heightened all parameters of infection. Nitazoxanide in sub-MIC doses, administered for three days at the time of EAEC challenge, lessened growth shortfalls (by > 10 % of body weight), stool shedding, (by 2-3 logs/10mg of stool) and tissue burden of organisms (by > 75% in jejunum and colon)
Conclusions The weaned C57BL/6 mouse challenged with EAEC is a convenient, readily inducible model of EAEC infection with three highly quantifiable outcomes, and in which disease severity is dependent on nutritional status of the host and modifiable in the presence of inhibitors of pyruvate ferredoxin oxidoreductase such as Nitazoxanide.
Summary
EAEC strain 042 challenge of weaned malnourished C57Bl/6 mice causing growth short-falls and persistent stool shedding is a convenient, consistent model with quantifiable end-points for studying the pathogenesis and potential therapeutics of EAEC infection. Malnutrition caused by feeding a diet with moderately lower protein, fat, and micronutrients exacerbated growth shortfalls, stool shedding as well as the level and distribution of EAEC tissue burden throughout the intestinal tract. Further, nitazoxanide prevented growth shortfalls in this model while the higher dose administered prior to challenge significantly reduced pathogen stool shedding. Future studies are needed to identify putative virulence factors associated with EAEC that are responsible for disease in the model.
Conclusions
This model can help elucidate potential mechanisms involved in the vicious cycle of enteric infection and malnutrition, as well as enable study of novel interventions to interrupt this cycle that is so devastating to the development of children in impoverished areas worldwide.
Data Figures
-
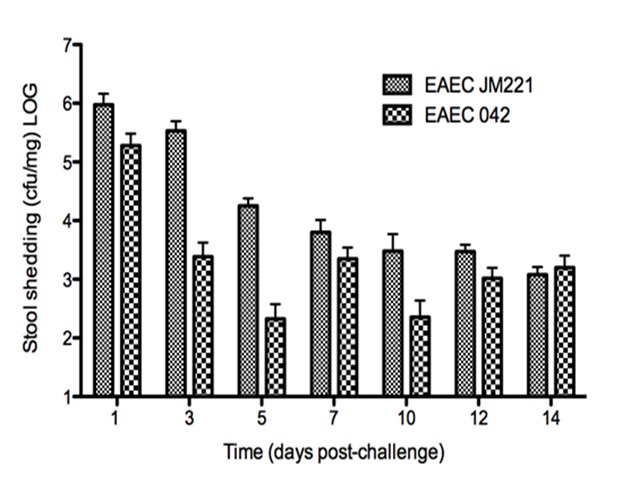 Figure 2. Stool shedding in weaned nourished mice challenged with strains of enteroaggregative Escherichia coli (EAEC).
-
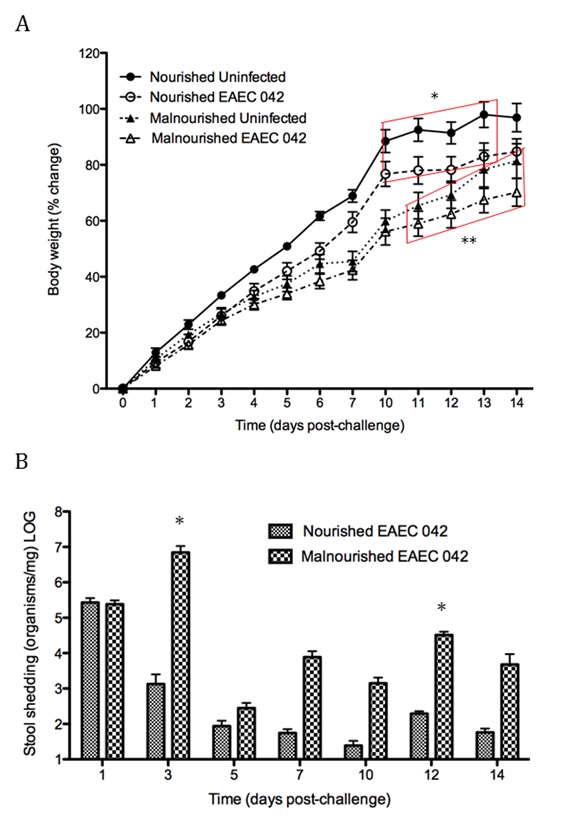 Figure 3. Effect of diet on growth rate and stool shedding in weaned C57Bl/6 mice challenged with EAEC strain 042.
-
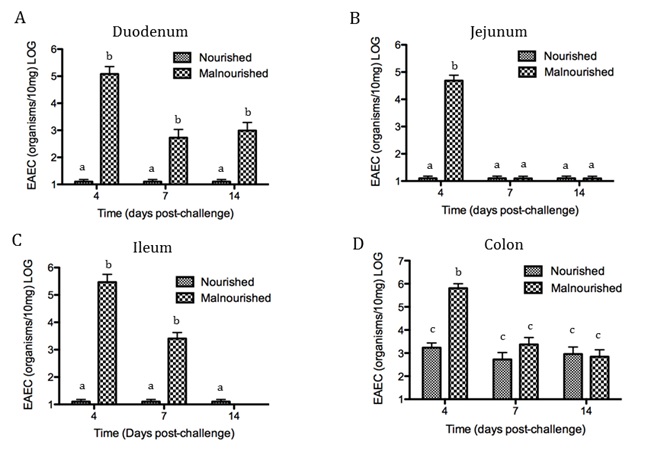 Figure 4. Tissue burden of EAEC in four regions of intestine, as affected by nutritional status.
-
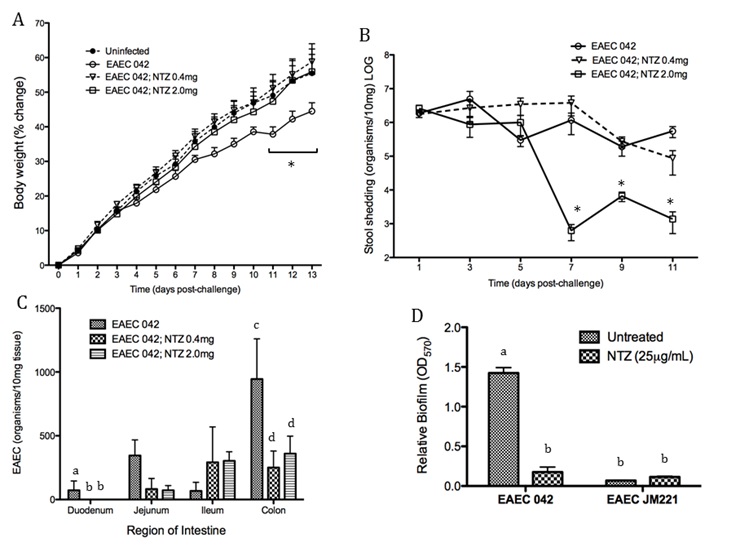 Figure 5. Preventive effects of nitazoxanide (NTZ) administration on growth rate, stool shedding, and intestinal tissue burden in weaned malnourished C57Bl/6 mice challenged with EAEC strain 042 (2.0 x 10¹⁰/mouse) or Dulbecco’s modified Eagle medium (vehicle control) via oral gavage at day 0.
-
 Figure 6. Effect of post-challenge nitazoxanide (NTZ) on growth rate, stool shedding and intestinal tissue burden in weaned malnourished C57BL/6 mice.
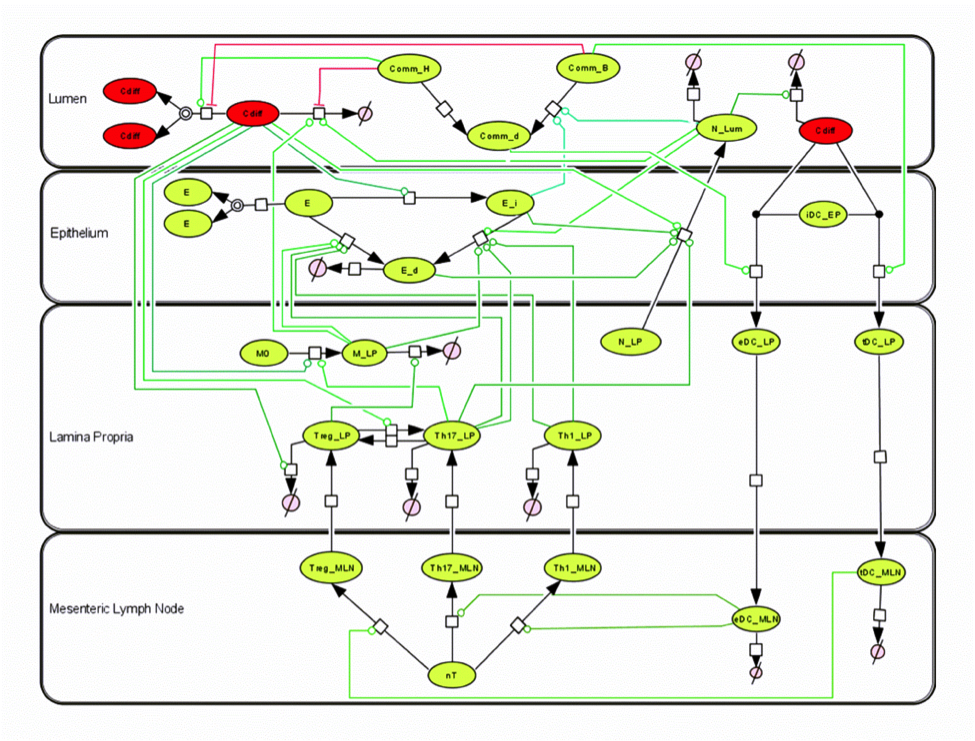 2015 C. Diff Model
Highlights
- Computational model captures dynamics of C. difficile infection.
- Provides insight into the role of the microbiome on recovery and pathogenesis of disease.
- Provides means of evaluation of immunological mechanisms contributing to C. difficile clearance and immune-mediated damage.
Ongoing Efforts
Clostridium difficile infection (CDI) is a leading cause of diarrhea and pseudomembranous colitis in hospital acquired infection due to prolonged doses of antibiotics. To further understand the cellular dynamics and the overall host response to the C. difficile, we have generated a tissue-level computational model of CDI using ordinary differential equations (ODEs) to describe the experimentally observed dynamics from individual cells to the gut mucosal immune system. The computational model is comprised of four compartments (lumen, epithelium, lamina propria and mesenteric lymph nodes) and 23 species whose interactions are described by 30 reactions. The resulting ODEs utilize 49 parameters to describe the dynamics of the system.
Our computational model is able to capture the dynamics of various immune components, such as neutrophils, T cells and dendritic cells, as well as commensal bacteria populations throughout the course of C. difficile infection. Via simulations and sensitivity analysis, a crucial aspect of the infection was highlighted to be a Th17-dominated state at the peak of infection switching to a Treg-dominated state during resolution phases. The regrowth of beneficial commensal bacteria was identified to a key regulator of this switch and the overall balance between C. difficile clearance and collateral damage to the epithelium. Specifically, the simulated removal anti-microbial peptide associated inhibition of this regrowth through neutrophils and epithelial cells, was identified to be a potential mechanism for the lessening of disease severity.
The first release of the model was made available on August 21, 2015 (http://www.ebi.ac.uk/biomodels-main/BIOMD0000000583). The primary MIEP team member responsible for the maintenance of this model is Andrew Leber (ajleber@vbi.vt.edu) at the Virginia Bioinformatics Institute. Please contact this team member with any questions or comments.
Data Figures
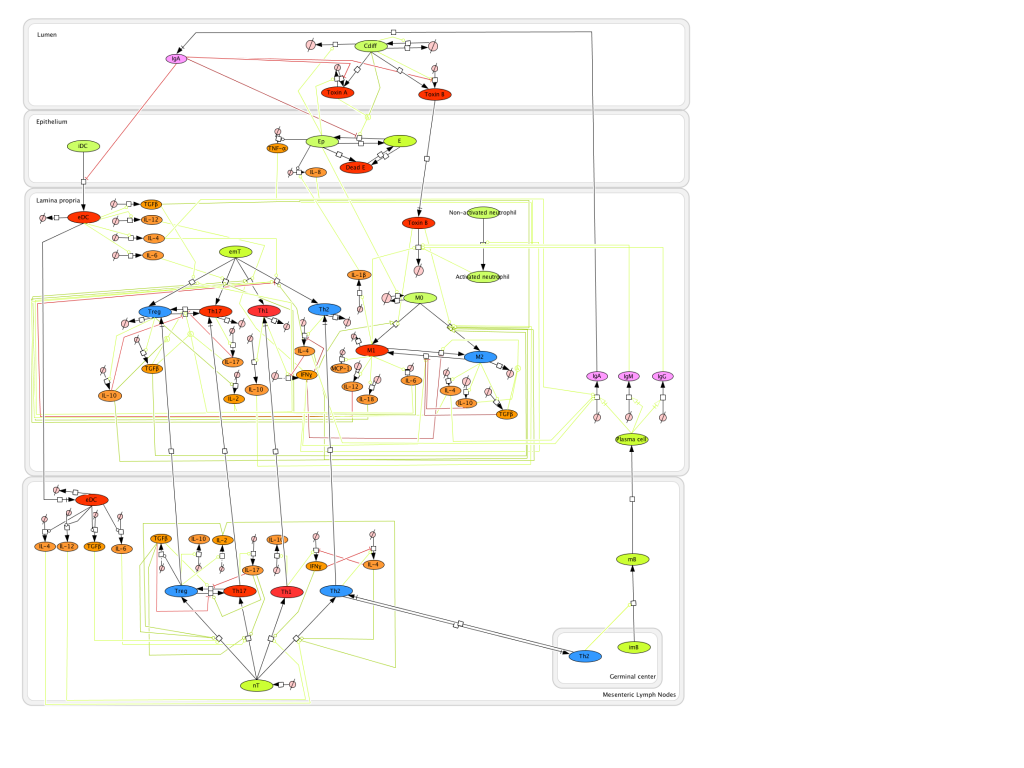 2012 C. Diff Model
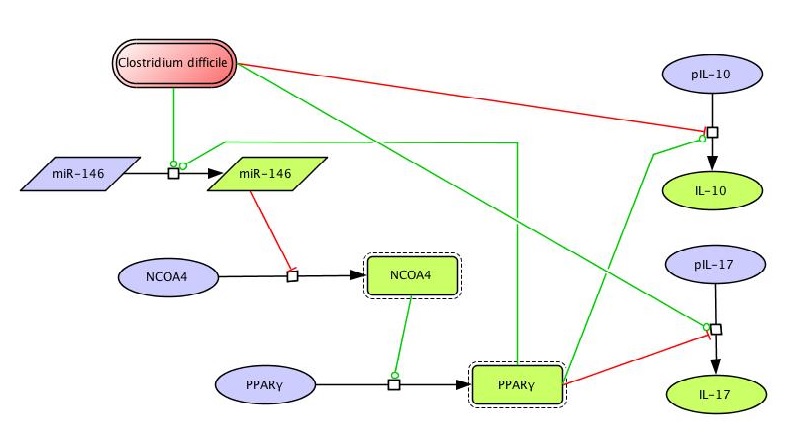 Figure 1. Clostridium difficile PPAR γ and miRNA-146b Model
About
Clostridium difficile is an anaerobic toxin-producing bacterium that has re-emerged as a facultative pathogen and can cause nosocomial diarrhea, colitis, and even death. The increased incidence and severity of C. difficile-associated disease (CDAD) over the last years, which correlates with the emergence of new hypervirulent strains, empathizes the importance of developing broad-based, host-targeted approaches to control the disease as opposed to just relying on the unsuccessful current anti-microbial therapies that target the bacterium and can stimulate the spread of antibiotic resistance. The integration of powerful computer simulations of host responses with immunology experimentation not only will contribute to a better understanding of the immunoregulatory processes in the gut mucosa during C. difficile infection, but it will also advance the discovery of new therapeutic targets in the host for infectious diseases. In this regard, we have applied ordinary differential equation (ODE)-based computational and mathematical modeling approaches in combination with RNA-sequencing and mouse challenge studies to characterize the disruption of an important regulatory pathway during Clostridium difficile infection. Link to the manuscript can be found here. Link to the model (MODEL1210260004) can be found here.
Model construction
The network The network model of colonic gene expression changes during C. difficile infection was designed based on the experimental data generated in our laboratory which describes the disruption of the peroxisome proliferator-activated receptor gamma (PPARγ) pathway during C. difficile infection, including a possible relationship between this nuclear receptor and microRNAs (Figure 1).
Once all the relationships between molecules were set, they were incorporated in CellDesigner, a software package that enables users to describe molecular interactions using a well-defined and consistent graphical notation. The network model has five dynamic variables representing miR-146b, NCOA4, PPARγ, interleukin 17 (IL-17) and IL-10, plus an external input: the infectious dose of C. difficile. Parameter estimation for dynamics adjustment Since CellDesigner and our MIEP-developed modeling software, the COmplex PAthway SImulator (COPASI), work both in Systems Biology Markup Language (SBML), we imported the network into COPASI and adjusted the rate laws to create the ODEs (Figure 2).
Briefly, mass action and Hill functions were used to reproduce reaction behaviors in silico based on initial molecule concentrations. The parameter estimation computational approach was used to determine the unknown constants driving the dynamics of the model. Briefly, we used the Particle Swarm Optimization (PSO) algorithm to select the values of those parameters to minimize the difference between experimental data. PSO is a global search algorithm and thus depends only minimally on the initial guess of each parameter and therefore avoids the subjective estimation caused by initial guesses in local methods as Levenberg-Marquardt. The results on the parameter estimation using Particle Swarm showed a good fitting between the experimental data and the values computationally estimated by COPASI with reduced weighted error (Table 1). These values were then implemented in the reactions and rate laws to adjust the dynamics of the model. Once the parameters were set, a quality control check was run to guarantee that the reactions are being activated promptly at the correct time with the right signal.
A species is fitted computationally using experimental data and simulation algorithms. The objective value is the value that COPASI targets based on the experimental data and the computational simulation. In silico experimentation At this point, the model was ready to start running in silico experimentation and generating predictions with the right initializations. The computational simulations predicted an aberrant expression of miR-146b following C. difficle infection, resulting in decreased concentrations of NCOA4, which in turn fails to activate PPAR γ. The lack of PPAR γ favors increased IL-17 production, and decreases the expression of IL-10 (Figure 3).
In line with the experimental data, IL-17 expression also increases with the infection. The following is a list of archived Clostridium difficile PPAR γ and miRNA-146b model releases. Please click on individual releases for more details.
- First, the latest, release on July 7th, 2012
- The COPASI model file released on September 17th, 2012
The primary MIEP team member responsible for maintaining this model is Monica Viladomiu at the Virginia Bioinformatics Institute. Please contact Monica with any questions or comments. This is an archived version of Clostridium difficile PPAR g and miRNA-146b model released on July 7th, 2012. The model is available for download in CellDesigner xml format and COPASI cps format, which is also available in BioModels Database. We have tested that the model is compatible with Cell Designer 4.1. The following is the structure figure of the model, and by clicking on the figure you can navigate the model through a Google-Map-API-enabled CellPublisher user friendly interface.
Data Figures
-
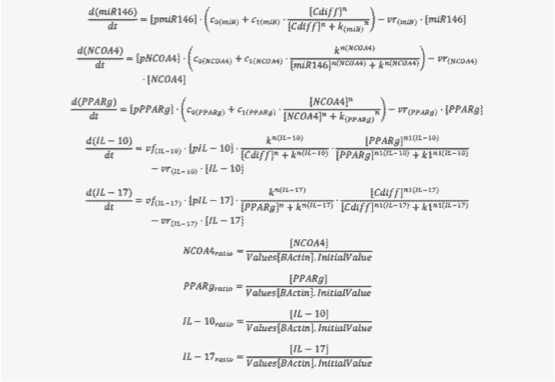 Figure 2. Ordinary Differential Equations triggering activation and inhibition of the different reactions in the model
-
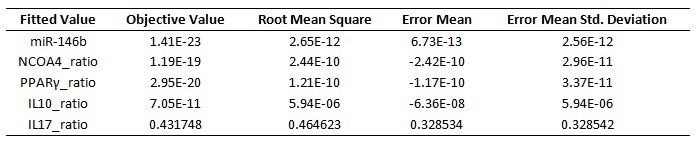 Table 1. Model fitting performed by using COPASI’s global parameter estimation
-
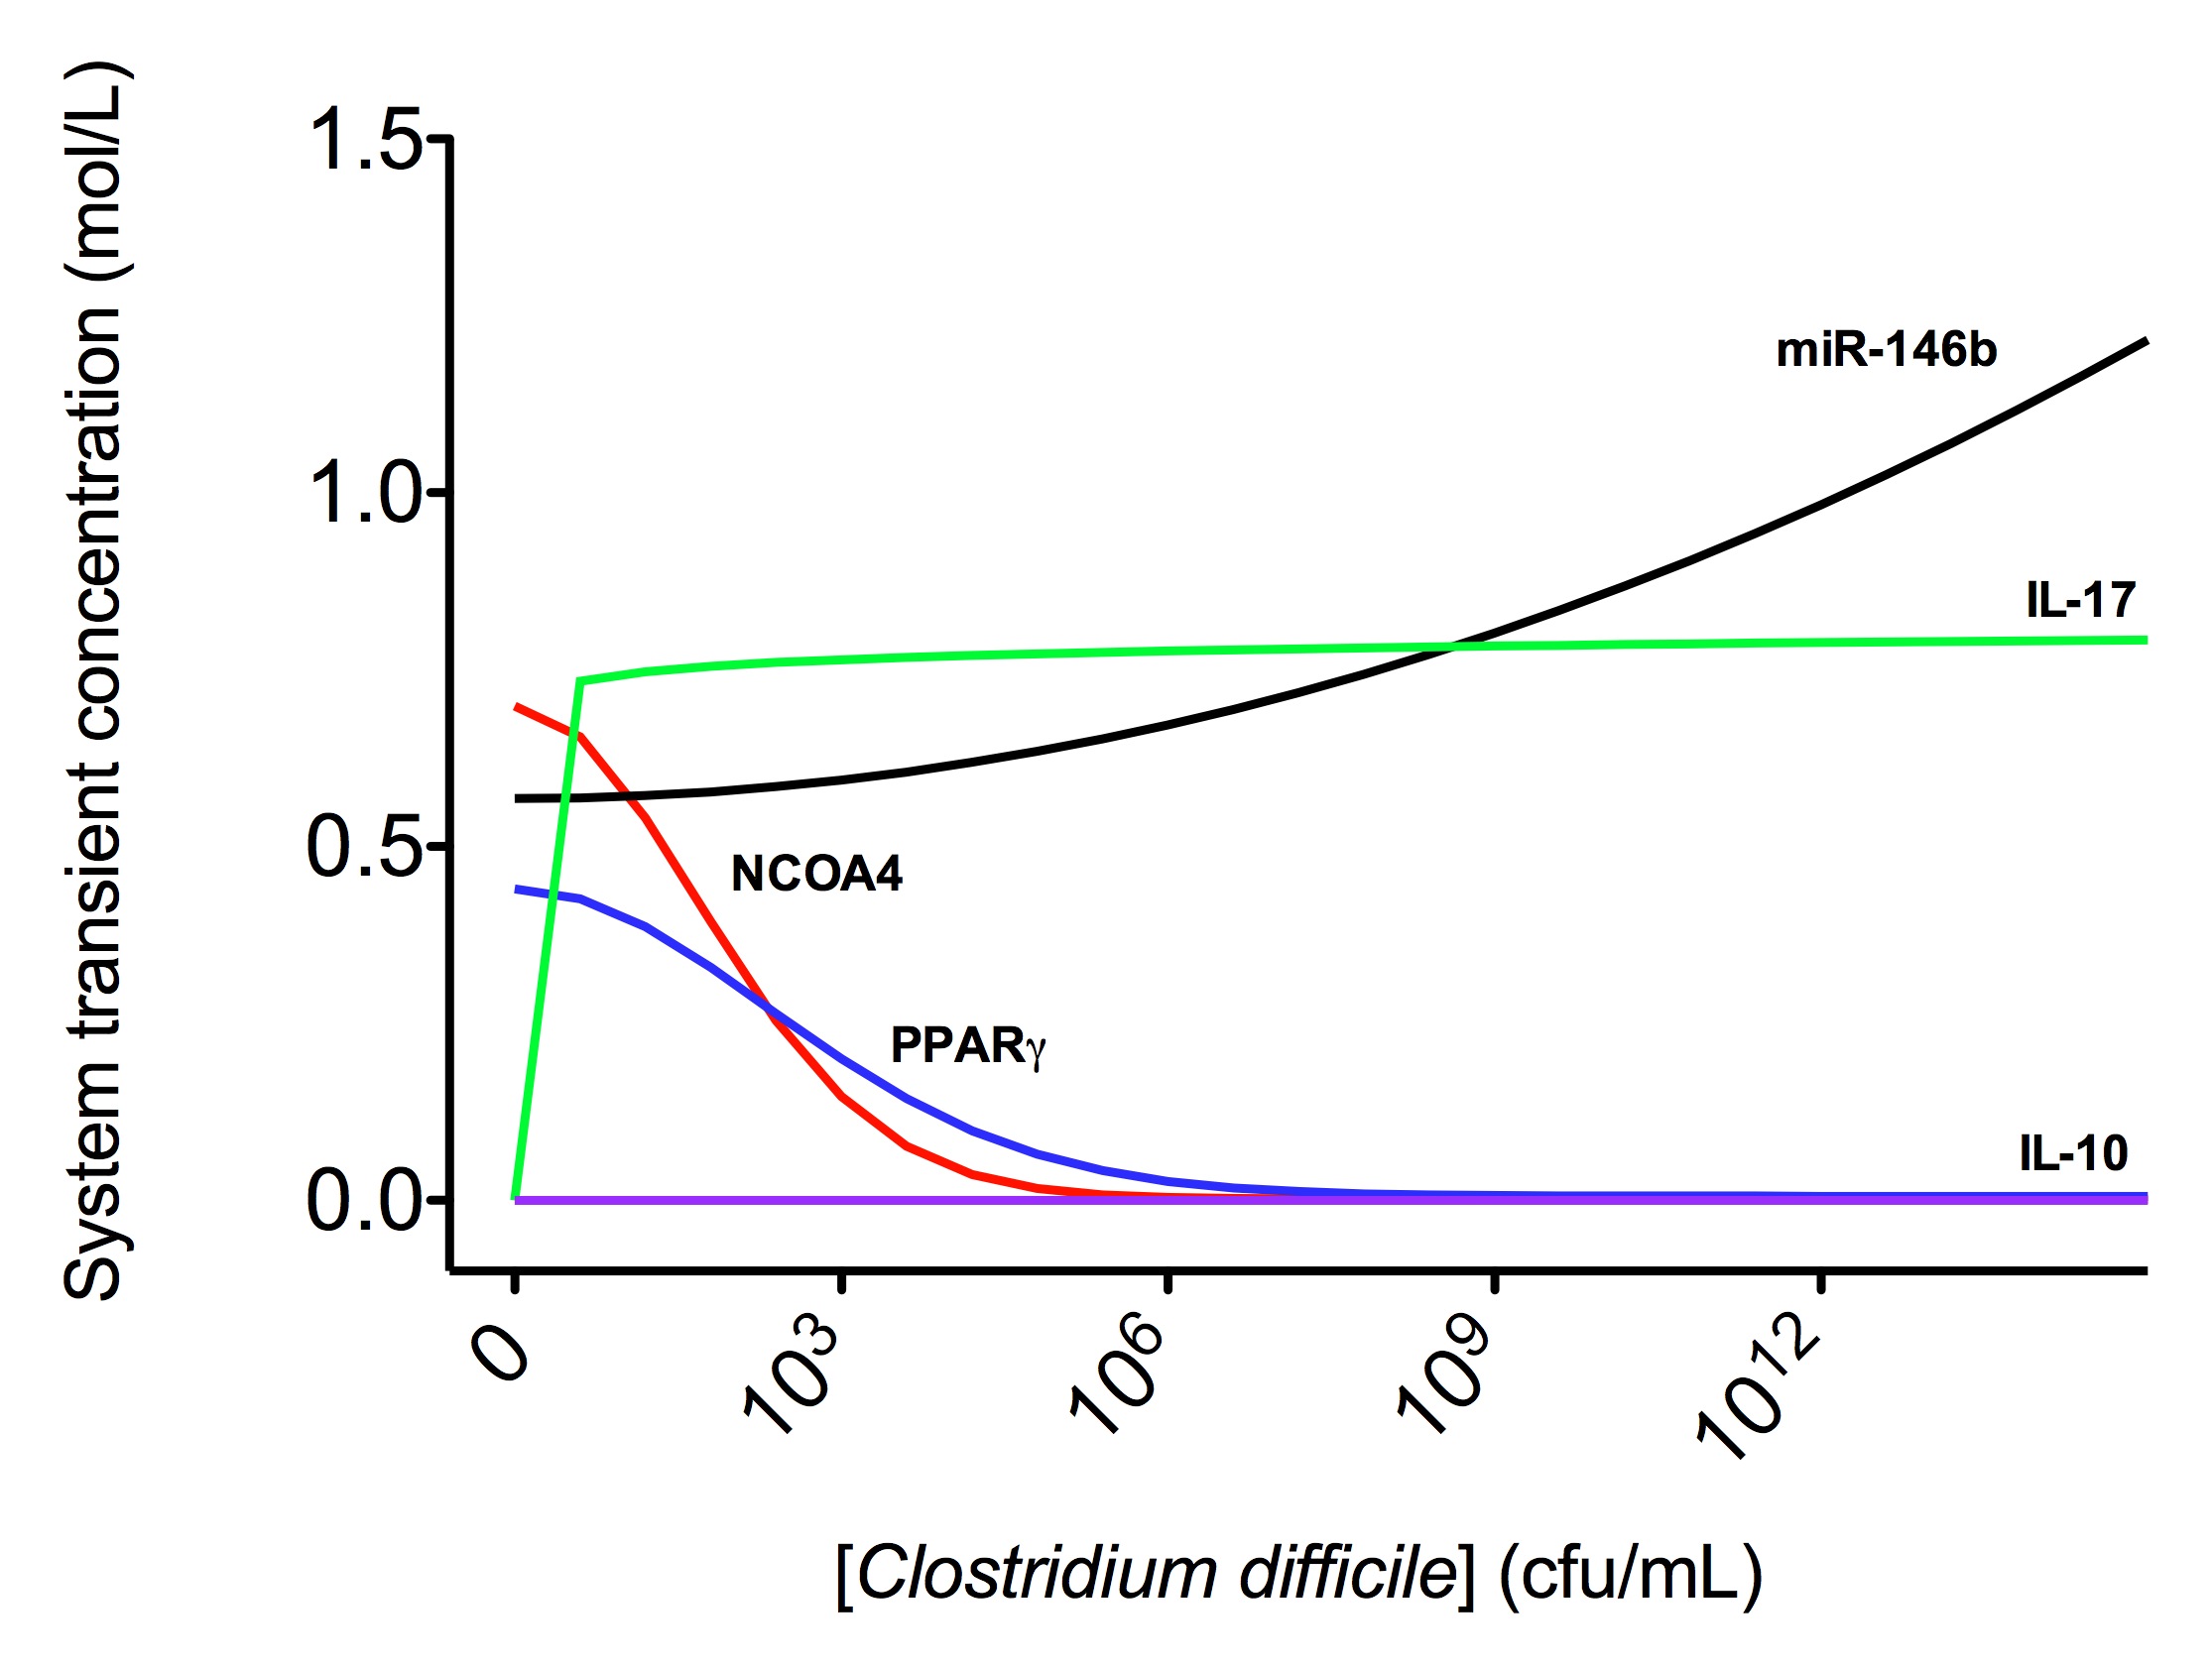 Figure 3. Computational modeling of mucosal immune responses to Clostridium difficile infection
-
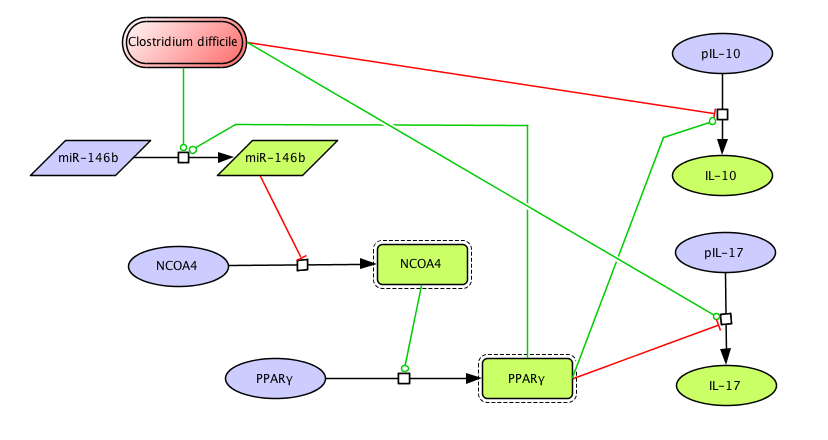 Clostridium difficile PPAR γ and miRNA-146b Model
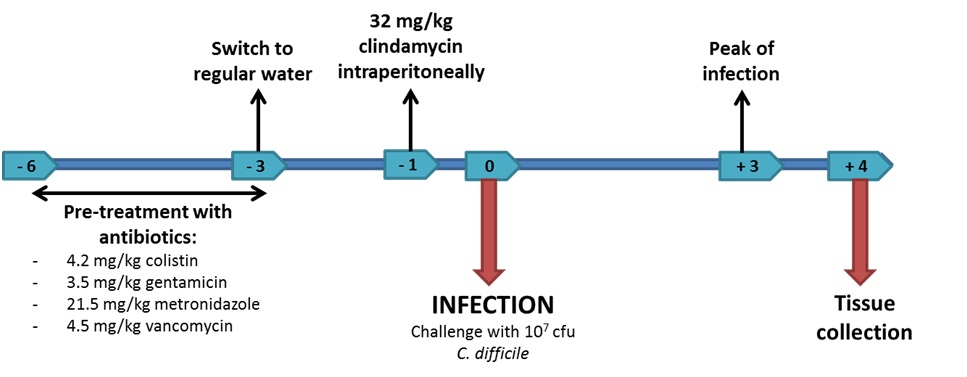 Figure 1. Experimental design for Clostridium difficile experimental challenges in mice.
Highlights
- Using high-throughput sequencing techniques to investigate the regulation of host responses towards C. difficile by miRNAs and to identify novel disease biomarkers and therapeutic targets
- Combining computational modeling and experimental immunology to characterize and understand the mucosal immune responses towards C. difficile
- Investigating the role and pathogenicity of CD4 T cells during C. difficile infection
Background and Epidemiology
Clostridium difficile infection is currently the leading cause of diarrhea in the healthcare setting, resulting in an average of 14,000 deaths in the US each year. The incidence and severity of C. difficile infection is increasing, due in part to the emergence of new strains that present higher sporulation, toxin production and resistance to antibiotics. Current available treatments are unsuccessful in bacterial clearance and complete patient remission as illustrated by the 30% disease relapse in infected individuals.
Clostridium difficile is an environmental Gram-positive, anaerobic, spore-forming bacillus belonging to the phylum Firmicutes. It is currently the leading cause of diarrhea in the healthcare setting and becoming an increasingly common cause of diarrhea in industrialized countries [1]. Although it is not considered part of the human microbiome, C. difficile colonizes and can be isolated from about 1-5% of healthy adult population and 75% of infant mammals, with an increase to 39% in hospitalized patients [2]. However, only the toxin-producing strains are associated with the diarrheic disease C. difficile infection (CDI). Many countries have reported an increase in both incidence and severity of CDI over the last few years [3-5], probably due to the emergence of hypervirulent strains including BI/NAP1/027. These new quinolone-resistant, hypertoxinogenic, binary toxin-producing C. difficile strains pose a growing threat to most health care settings, where patients accidentally ingest spores of the bacterium in the context of destruction of commensal bacteria due to broad-spectrum antibiotic treatment. Therefore, such recently emerged C. difficile strains are responsible for increased morbidity, mortality and healthcare costs in the US, Canada and Europe, primarily due to toxic megacolon, septic shock, intestinal perforation, and resistance to fluoroquinolone antibiotics [2, 6-8]. Some examples of recent relevant outbreaks include:
- Quebec, 2002: 17% mortality [9]
- Quebec, 2003: 13.4% mortality [9]
- 2000-2010, Montreal: Estimate of 2,000 total deaths
- 2003, St. Louis: 6% mortality [10, 11]
According to the Agency for Healthcare Research and Quality Nationwide Inpatient Sample, there were approximately 139,000 patients discharged from acute care facilities who were diagnosed with C. difficile infection in 2000. This number increased to 336,000 patients in 2008. In the United States alone, CDI was estimated to affect over 500,000 people and to cost the healthcare system over $3 billion in 2009 [12].
Pathogenesis
CDI is a nosocomial toxin-mediated intestinal disease which can result in a wide range of clinical outcomes:
- Asymptomatic colonization
- Mild to severe diarrhea
- Abdominal pain
- Fever
- Leukocytosis
- Colitis with or without the presence of pseudomembranes
- Toxic megacolon or bowel perforation
- Sepsis
- Death
Other rare manifestations associated with CDI are:
- Extra-intestinal infections
- Ileal infections
- Reactive arthritis
- Post-proctocolectomy enteritis
- Bacteremia
The severity of the symptoms mostly depends on the properties of the C. difficile strain, which is usually characterized by the genetic-dependent ability to produce toxins.
Current treatments
Prevention and control of C. difficile infection is a major public health challenge. Advanced age is a risk factor for development and death from C. difficile-associated disease. In addition, the Centers for Disease Control and Prevention have reported expanded susceptible populations that now include children and previously healthy young women. While antibiotics are effective in inhibiting the organism and treating symptoms, recurrent C. difficile infection occurs in up to 15-30 % of cases after cessation of treatment. Management of recurrent C. difficile infection has met with variable success and too often failure. Thus, a better understanding of mucosal immune responses to C. difficile is needed for the rational development of novel therapies against this organism. Several studies have been published related to immune responses to C. difficile: 1. C. difficile toxins TcdA and TcdB breach the intestinal barrier and trigger mucosal inflammation and intestinal damage. The inflammasome is an intracellular danger sensor of the innate immune system. This study found that TcdA and TcdB triggered inflammasome activation and IL-1β secretion in macrophages and in human mucosal biopsy specimens. The IL-1β release required recognition of the full-length toxin but not its enzymatic function. Pre-treating mice with the IL-1 receptor antagonist anakinra protected the host to a degree similar to that seen in the caspase 1 adaptor ASC-/- mice. These data suggest new therapeutic targets in the treatment of C. difficile-associated disease [13]. 2. Fidaxomicin is a new antibiotic with increased in vitro activity again C. difficile and a low rate of absorption from the intestinal tract. This phase 3 clinical trial compared the efficacy and safety of fidaxomicin with those of vancomycin (standard therapy) in treating C. difficile infection. A total of 629 patients were randomized to receive one drug or the other orally for 10 days. Rates of initial symptomatic relief were similar for both drugs (intention-to-treat analysis, 88.2% versus 85.8%). However, significantly fewer patients in the fidaxomicin group than in the vancomycin group has a recurrence of the infection (intention-to-treat analysis, 15.4% versus 25.3%). The adverse-event profile was similar for the two therapies. These results suggest a new antibiotic for front-line therapy of C. difficile infection [14]. 3. New therapies are needed to combat the high rate of recurrence of C. difficile infection. A randomized, double-blind placebo-controlled study has been recently reported of two neutralizing, fully human monoclonal antibodies against C. difficile toxins A (CDA1) and B (CDB1). Antibodies were administered as a single IV infusion, 10 mg/Kg of body weight, in patients with symptomatic C. difficile infection receiving metronidazole or vancomycin. Among 200 patients enrolled, the rate of recurrence of C. difficile infection was significantly lower among those treated with monoclonal antibodies (7% vs. 25%, p<0.001). Among patients with more than one previous episode of C. difficile infection, recurrence rates were 7% and 38%, respectively (p<0.006). The serious adverse event rate was not different between the two groups. This study suggests that the addition of monoclonal antibodies against
C. difficile toxins to antibiotic agents significantly reduces the recurrence of C. difficile infection [15]. In light of the unsuccessful treatments that have been discovered and developed so far, MIEP is developing non-antibiotic (pharmacological) means of reducing the acute level of intestinal inflammation and preventing disease recurrence; using computational modeling approaches to identify pro-inflammatory mucosal cell types and/or locally generated cytokines that could be targeted to reduce clinical disease, yet allowing normal commensal microorganisms to re-populate the intestinal lumen; and developing an immuno-diagnostic that identifies early-on patient cases likely to have a severe course of disease (including recurrence) who will then be given alternative therapies.
Mouse model of C. difficile infection used in the MIEP studies
Previous studies have demonstrated that three days of pre-treatment with a mixture of antibiotics in the drinking water for 3 days is sufficient to disrupt the intestinal microflora and allow C. difficile infection [16]. The antibiotic mixture consists of colistin 850 U/mL (which corresponds to 4.2 mg/kg), gentamicin 0.035 mg/mL (which corresponds to 3.5 mg/kg), metronidazole 0.215 mg/mL (which corresponds to 21.5 mg/kg) and vancomycin 0.045 mg/mL (which corresponds to 4.5 mg/kg). A control group receiving no antibiotics is also included. Following the treatment all mice are given regular autoclaved water for 2 days and all mice including the control group receive a single dose of clindamycin (32 mg/kg) intraperitoneally 1 day before C. difficile challenge. On day 5 of the study mice are infected intragastrically with Clostridium difficile (107 cfu of strain VPI 10463 in the MIEP studies) (Figure 1). Mice are then weighed and scored daily to assess mortality and morbidity and the presence of diarrhea and other symptoms.
Modeling immunity to Clostridium difficile infection
Under the MIEP program we have investigated the role of Peroxisome Proliferator-Activated Receptor g and MicroRNA-146 in Mucosal Immune Responses to Clostridium difficile [17]. Specifically, we have applied computational and mathematical modeling approaches in combination with RNA-sequencing and mouse challenge studies to characterize the disruption of an important regulatory pathway during Clostridium difficile infection. We have found that tissue damage and disease severity in C. difficile infection is associated with a disruption of the peroxisome proliferator-activated receptor gamma (PPARγ) pathway, including a possible relationship between this nuclear receptor and microRNAs (Figure 2). Activation of PPARγ by using a diabetes drug ameliorated C. difficile-related gut pathology and disease in mouse challenge studies. Thus, PPARγ helps keep the immune response in check, allowing the body to heal but also allowing the immune cells that fight infection to do their work in a controlled manner. When PPARγ was absent or not activated, disease was more rampant and colonic lesions from C. difficile were much worse. For more information regarding this project, click here.
References
1. Lo Vecchio, A. and G.M. Zacur, Clostridium difficile infection: an update on epidemiology, risk factors, and therapeutic options. Curr Opin Gastroenterol, 2012. 28(1): p. 1-9.
2. Barbut, F., G. Jones, and C. Eckert, Epidemiology and control of Clostridium difficile infections in healthcare settings: an update. Curr Opin Infect Dis, 2011. 24(4): p. 370-6.
3. Lim, P.L., et al., Increasing incidence of Clostridium difficile-associated disease, Singapore. Emerg Infect Dis, 2008. 14(9): p. 1487-9.
4. Khanna, S. and D.S. Pardi, The growing incidence and severity of Clostridium difficile infection in inpatient and outpatient settings. Expert Rev Gastroenterol Hepatol, 2010. 4(4): p. 409-16.
5. Zilberberg, M.D., A.F. Shorr, and M.H. Kollef, Increase in adult Clostridium difficile-related hospitalizations and case-fatality rate, United States, 2000-2005. Emerg Infect Dis, 2008. 14(6): p. 929-31.
6. Loo, V.G., et al., A predominantly clonal multi-institutional outbreak of Clostridium difficile-associated diarrhea with high morbidity and mortality. N Engl J Med, 2005. 353(23): p. 2442-9.
7. Khanna, S., et al., The epidemiology of community-acquired Clostridium difficile infection: a population-based study. Am J Gastroenterol, 2012. 107(1): p. 89-95.
8. Kuehn, B.M., Scientists seek strategies to prevent Clostridium difficile infections. JAMA, 2011. 306(17): p. 1849-50.
9. Weiss, K., et al., Multipronged intervention strategy to control an outbreak of Clostridium difficile infection (CDI) and its impact on the rates of CDI from 2002 to 2007. Infect Control Hosp Epidemiol, 2009. 30(2): p. 156-62.
10. Dubberke, E.R., et al., Attributable outcomes of endemic Clostridium difficile-associated disease in nonsurgical patients. Emerg Infect Dis, 2008. 14(7): p. 1031-8.
11. Warny, M., et al., Toxin production by an emerging strain of Clostridium difficile associated with outbreaks of severe disease in North America and Europe. Lancet, 2005. 366(9491): p. 1079-84.
12. Rupnik, M., M.H. Wilcox, and D.N. Gerding, Clostridium difficile infection: new developments in epidemiology and pathogenesis. Nat Rev Microbiol, 2009. 7(7): p. 526-36.
13. Ng, J., et al., Clostridium difficile toxin-induced inflammation and intestinal injury are mediated by the inflammasome. Gastroenterology, 2010. 139(2): p. 542-52, 552 e1-3.
14. Louie, T.J., et al., Fidaxomicin versus vancomycin for Clostridium difficile infection. N Engl J Med, 2011. 364(5): p. 422-31.
15. Lowy, I., et al., Treatment with monoclonal antibodies against Clostridium difficile toxins. N Engl J Med, 2010. 362(3): p. 197-205.
16. Chen, X., et al., A mouse model of Clostridium difficile-associated disease. Gastroenterology, 2008. 135(6): p. 1984-92.
17. Viladomiu, M., et al., Modeling the role of peroxisome proliferator-activated receptor gamma and microRNA-146 in mucosal immune responses to Clostridium difficile. PLoS One, 2012. 7(10): p. e47525.
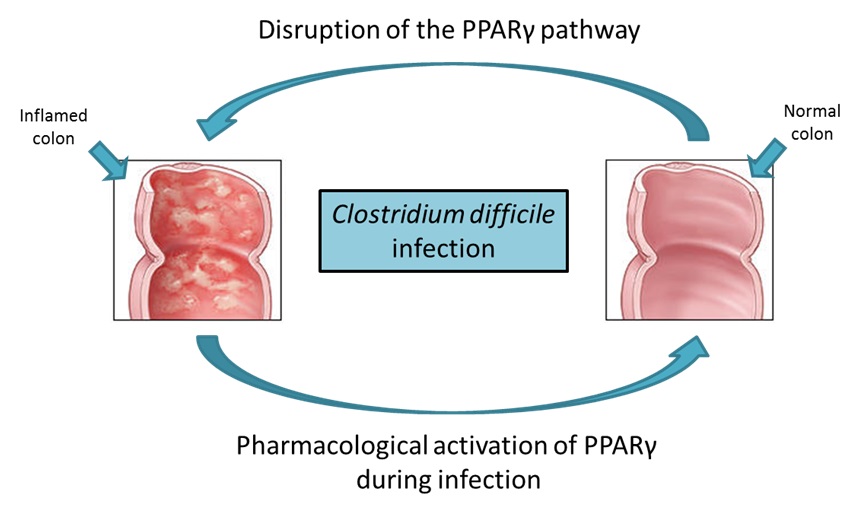 Figure 2. The role of the peroxisome proliferator-activated receptor γ (PPAR γ) pathway during Clostridium difficile infection.
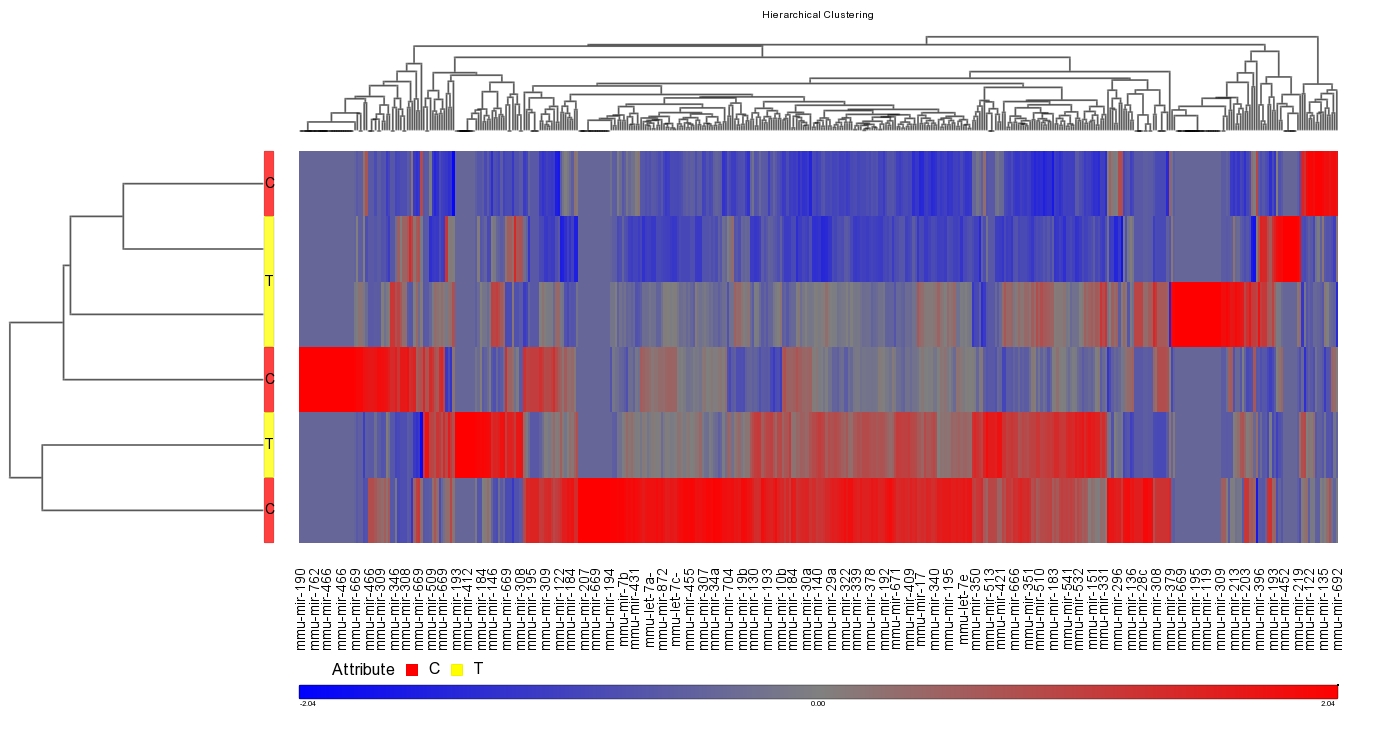 Figure 1. Effect of infection with Clostridium difficile strain VPI 10463 on miRNA differential expression in C57BL/6J wild-type mice.
Highlights
- We applied computational and mathematical modeling approaches in combination with RNA-sequencing and mouse challenge studies to characterize the disruption of an important regulatory pathway during Clostridium difficileinfection.
- We found that tissue damage and disease severity in C. difficile infection is associated with a disruption of the peroxisome proliferator-activated receptor gamma (PPARγ) pathway.
Abstract
Clostridium difficile is an anaerobic bacterium that has re-emerged as a facultative pathogen and can cause nosocomial diarrhea, colitis or even death. Peroxisome proliferator-activated receptor (PPAR) γ has been implicated in the prevention of inflammation in autoimmune and infectious diseases; however, its role in the immunoregulatory mechanisms modulating host responses to C. difficile and its toxins remains largely unknown. To characterize the role of PPARγ in C. difficile-associated disease (CDAD), immunity and gut pathology, we used a mouse model of C. difficile infection in wild-type and T cell-specific PPARγ null mice. The loss of PPARγ in T cells increased disease activity and colonic inflammatory lesions following C. difficile infection. Colonic expression of IL-17 was upregulated and IL-10 downregulated in colons of T cell-specific PPARγ null mice. Also, both the loss of PPARγ in T cells and C. difficile infection favored Th17 responses in spleen and colonic lamina propria of mice with CDAD. MicroRNA (miRNA)-sequencing analysis and RT-PCR validation indicated that miR-146b was significantly overexpressed and nuclear receptor co-activator 4 (NCOA4) suppressed in colons of C. difficile-infected mice. We next developed a computational model that predicts the upregulation of miR-146b, downregulation of the PPARγ co-activator NCOA4, and PPARγ, leading to upregulation of IL-17. Oral treatment of C. difficile-infected mice with the PPARγ agonist pioglitazone ameliorated colitis and suppressed pro-inflammatory gene expression. In conclusion, our data indicates that miRNA-146b and PPARγ activation may be implicated in the regulation of Th17 responses and colitis in C. difficile-infected mice. Click here to read the article. SUMMARY Clostridium difficile infection in WT mice resulted in a strong inflammatory immune response characterized by colonic leukocyte infiltration and mucosal thickening, as well as an increased production of pro-inflammatory cytokines including MCP-1, IL-6, IL-17 and IL-1β. miRNA-sequencing results revealed an up-regulation of three microRNAs within infection: miR-146b, miR-1940 and miR-1298 (Figure 1). MiRNAs are small (∼22–24-nucleotide), non-coding, single-stranded RNA molecules that contribute to regulating gene expression. Mature miRNAs are incorporated into the RNA-induced silencing complex where they typically recognize and bind to sequences in the 3′ untranslated regions, leading to suppression of translation and/or degradation of mRNA.
Data Figures
-
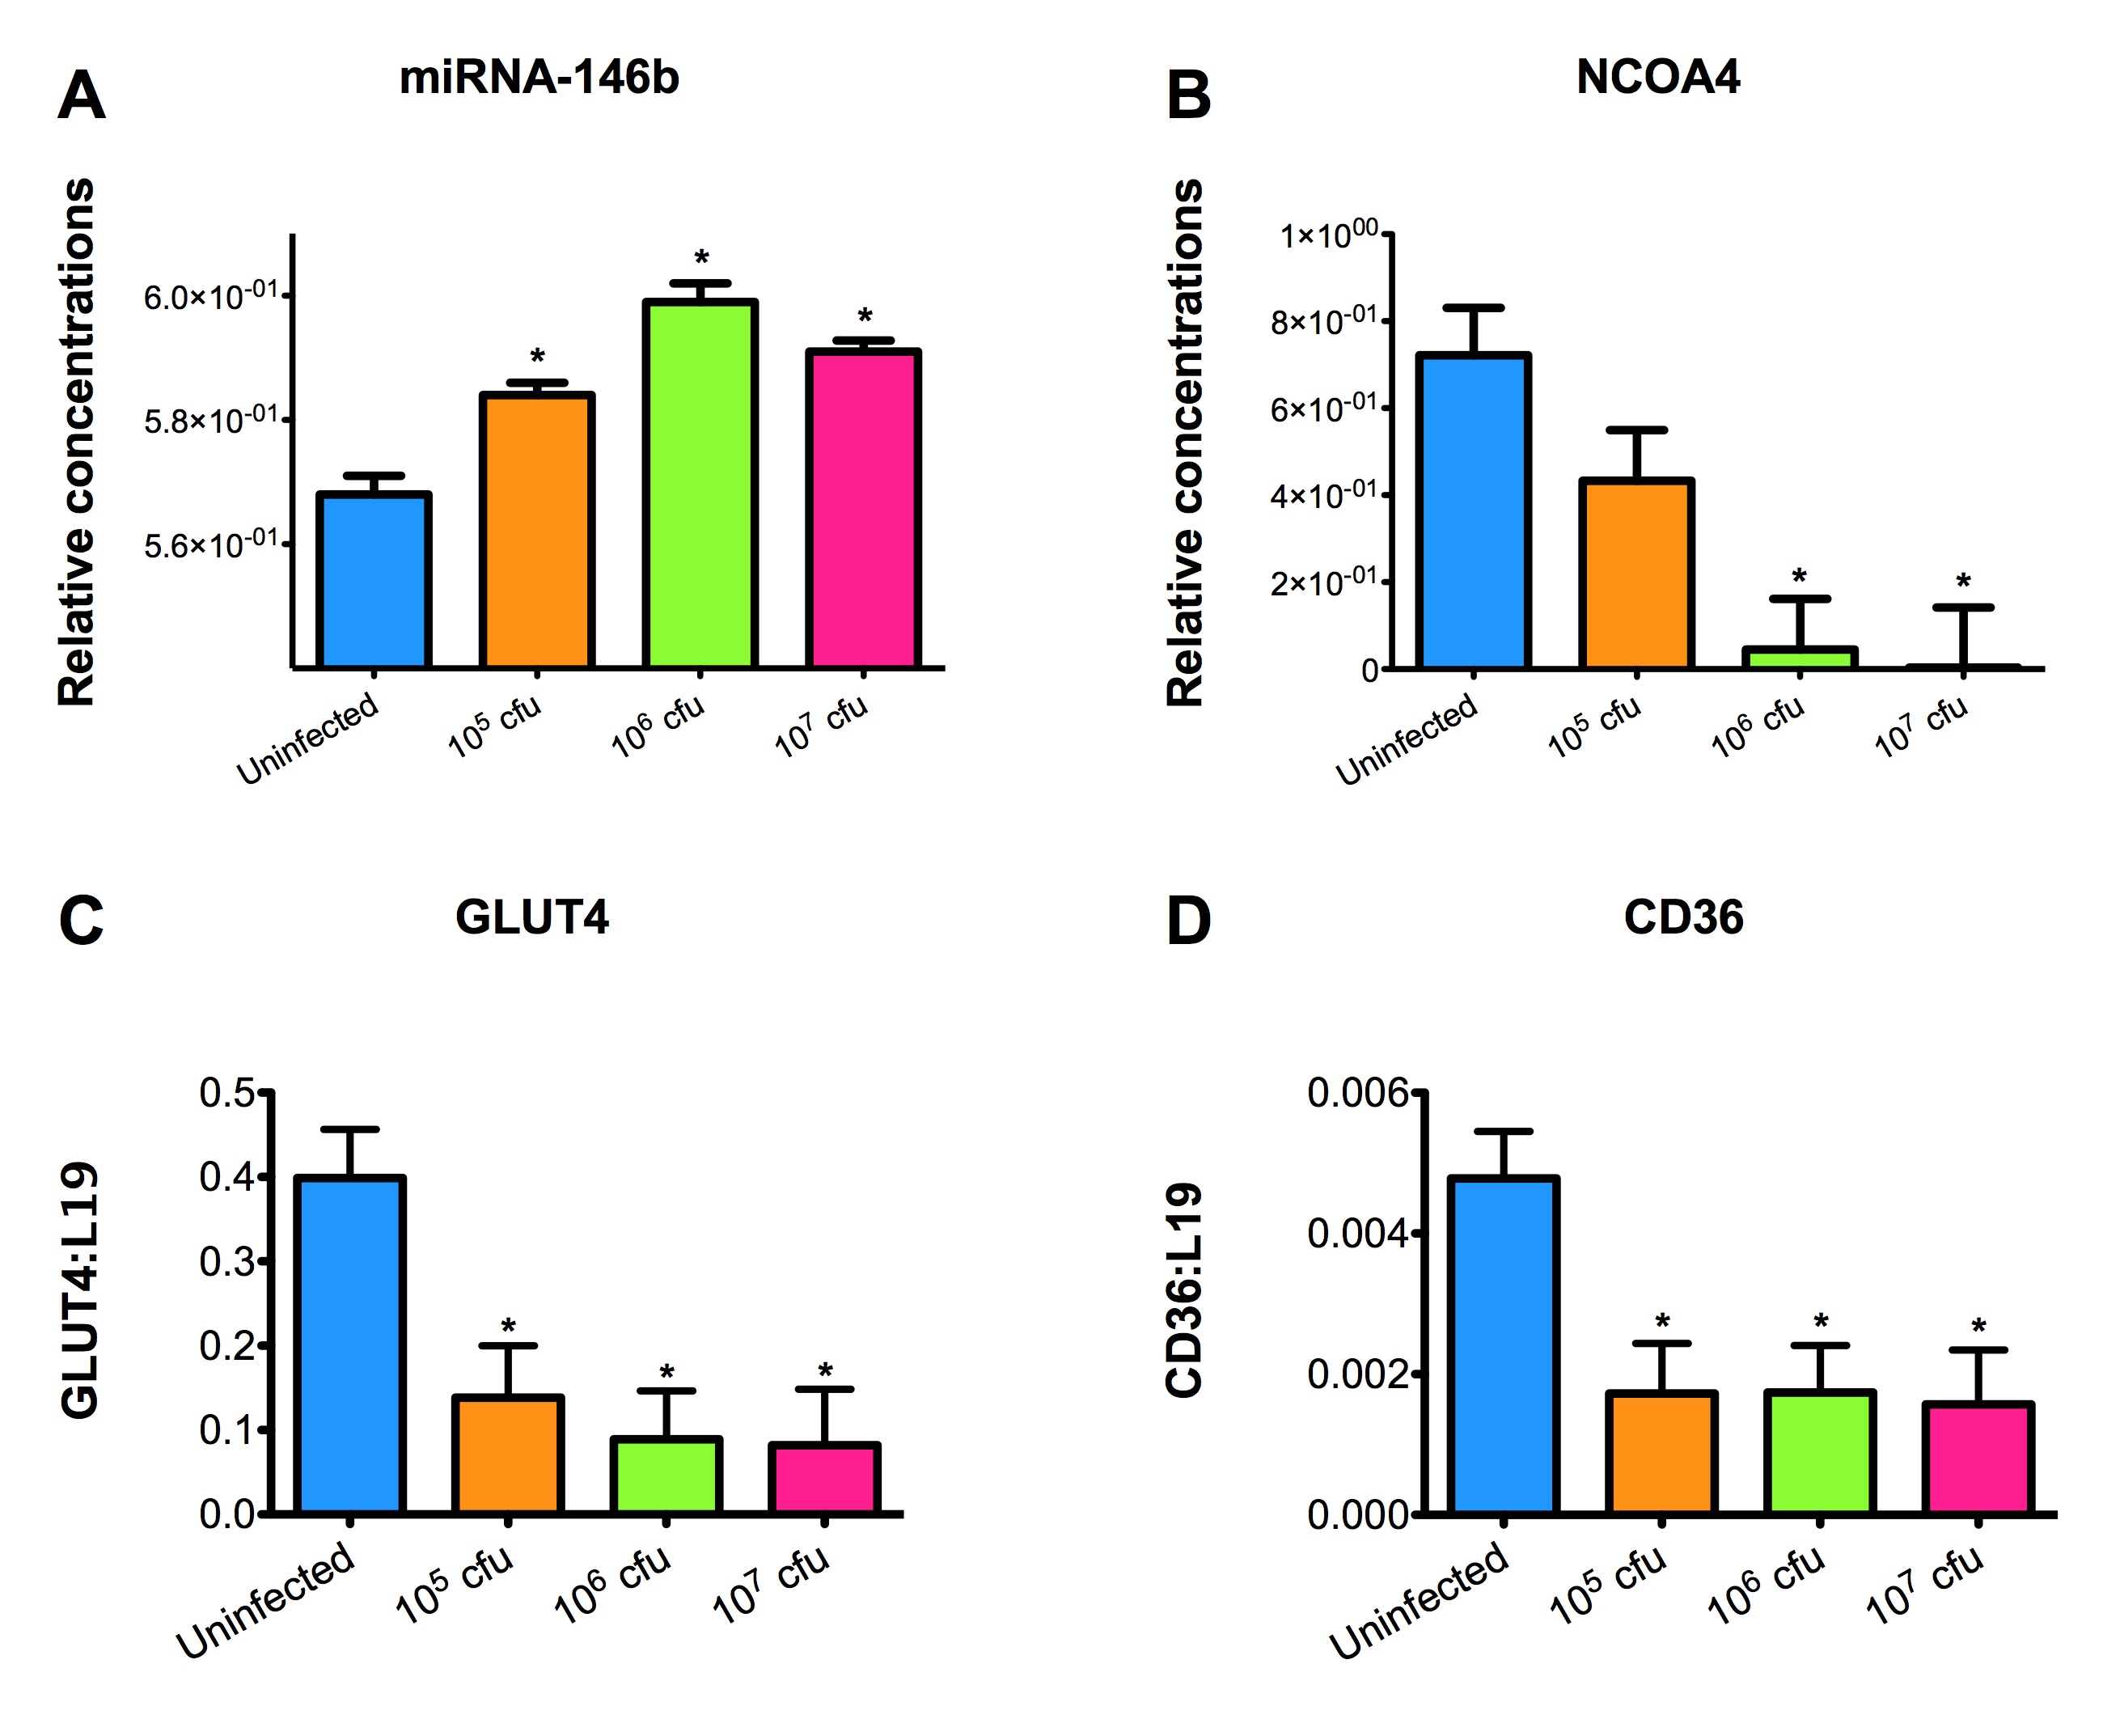 Figure 2. Effect of Clostridium difficile infection on the colonic expression of miR-146b and target genes NCOA4, CD36 and GLUT4 mRNA in mice.
-
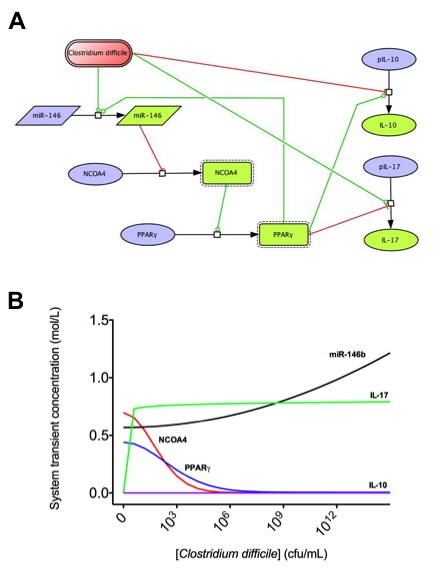 Figure 3. Computational modeling of mucosal immune responses to Clostridium difficile infection.
-
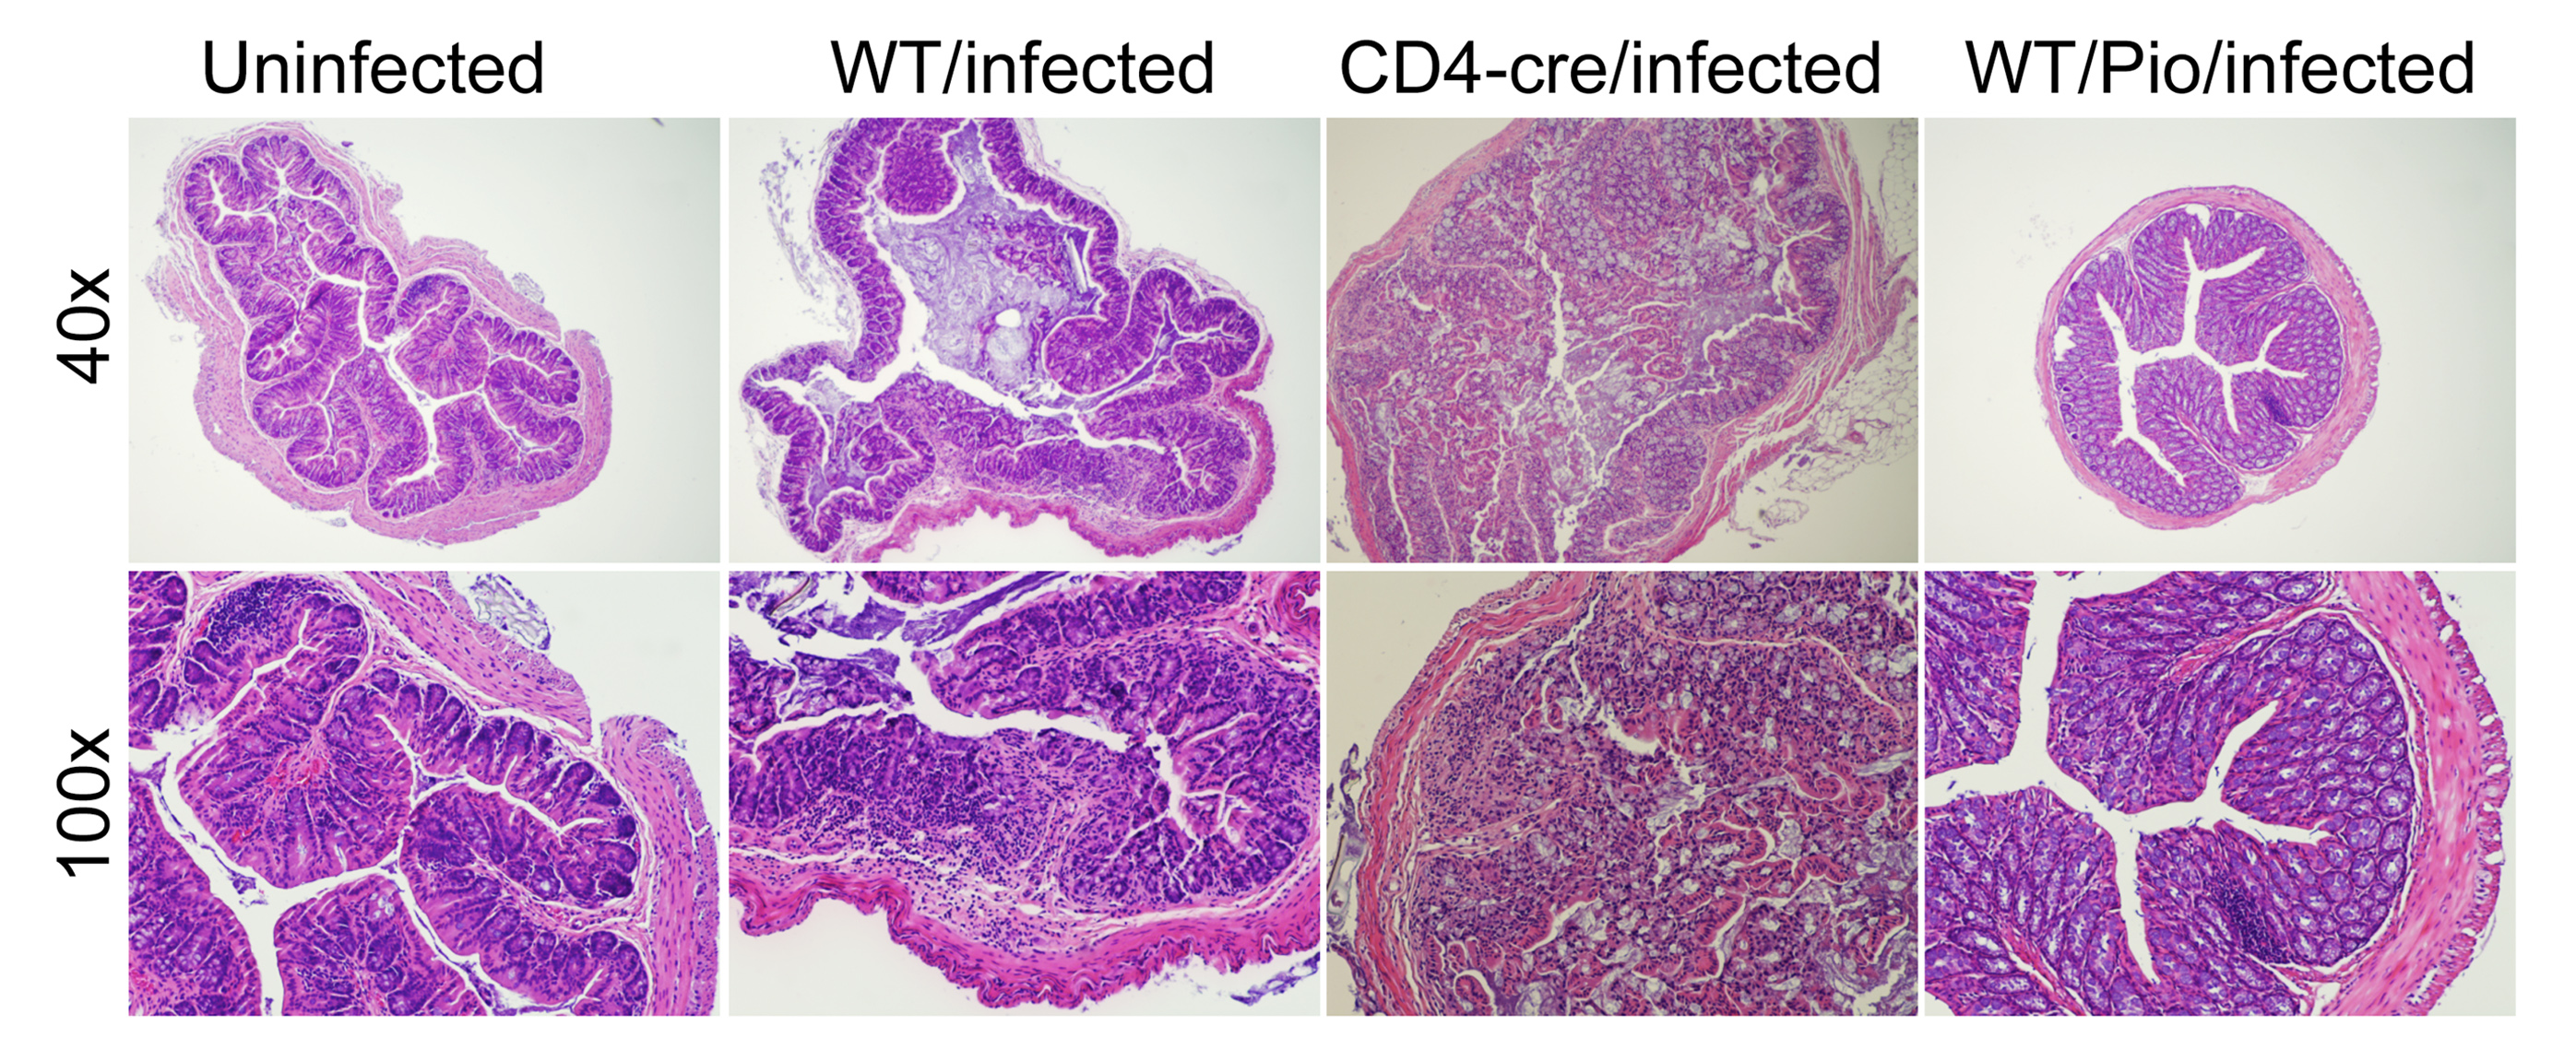 Figure 4. Impact of the loss of PPARγ in T cells and pharmacological activation of PPARγ colonic inflammatory lesions in Clostridium difficile-infected mice.
-
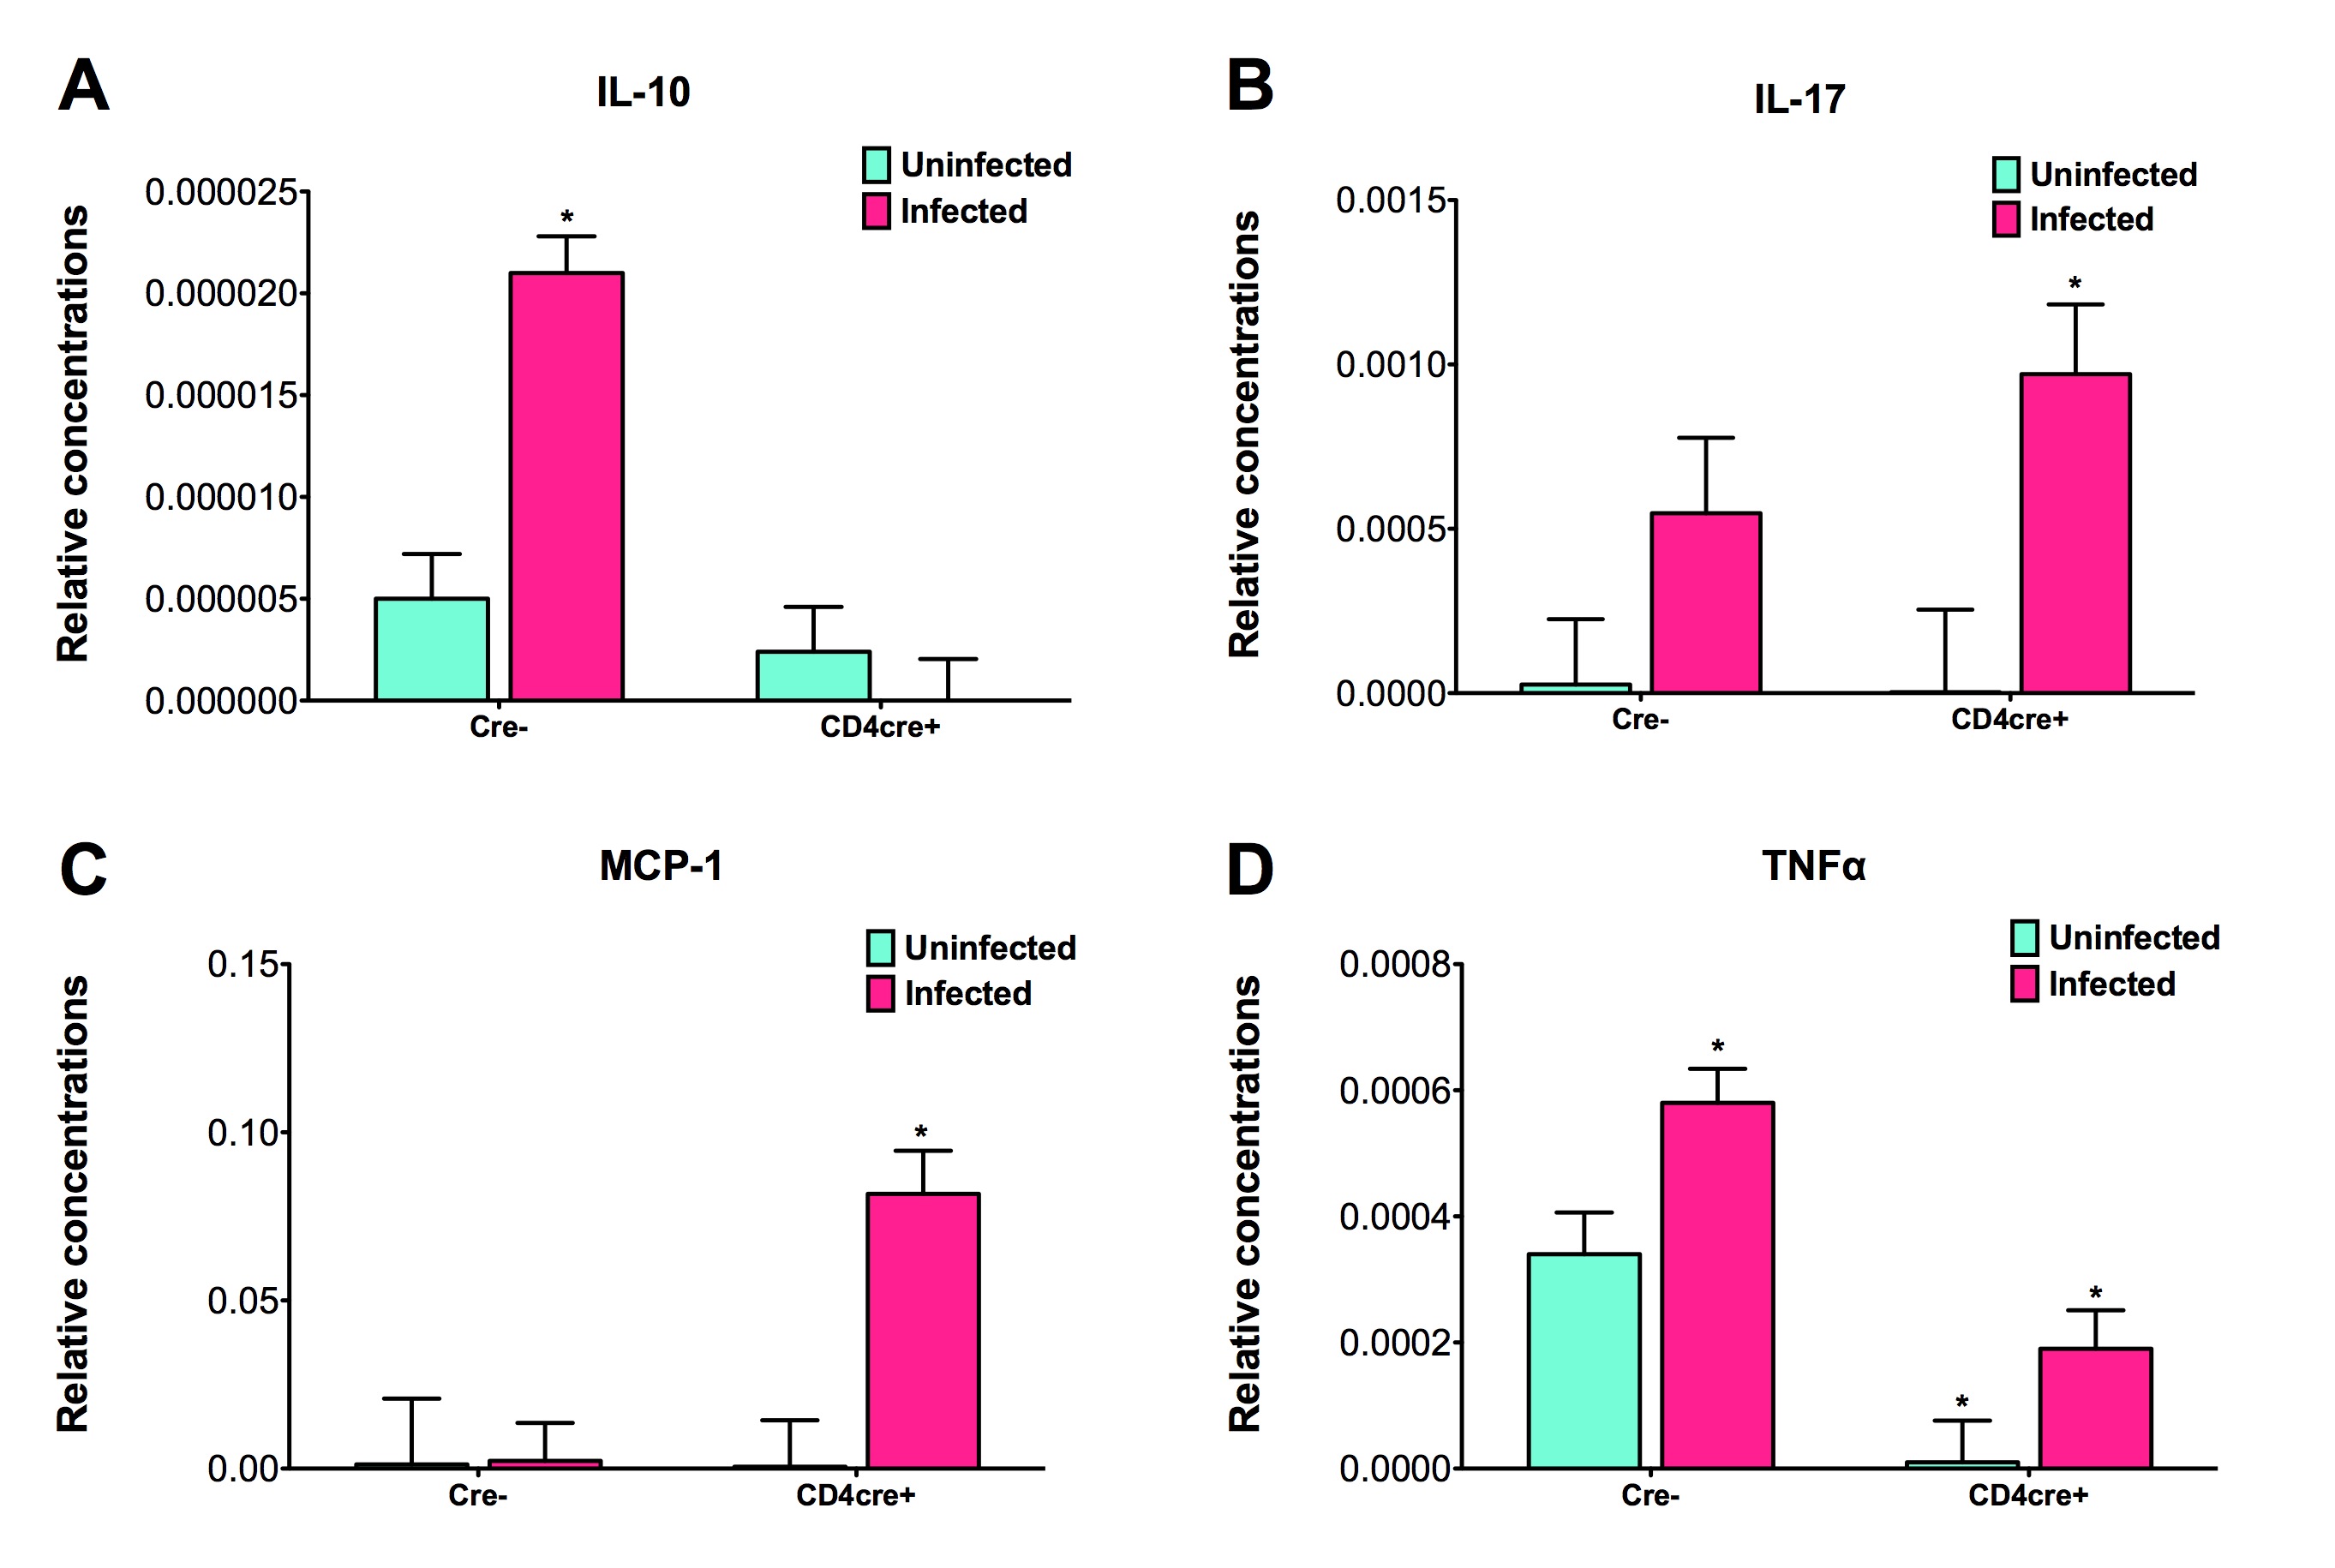 Figure 5. The loss of PPARγ in T cells regulates colonic cytokine expression of mice infected with Clostridium difficile.
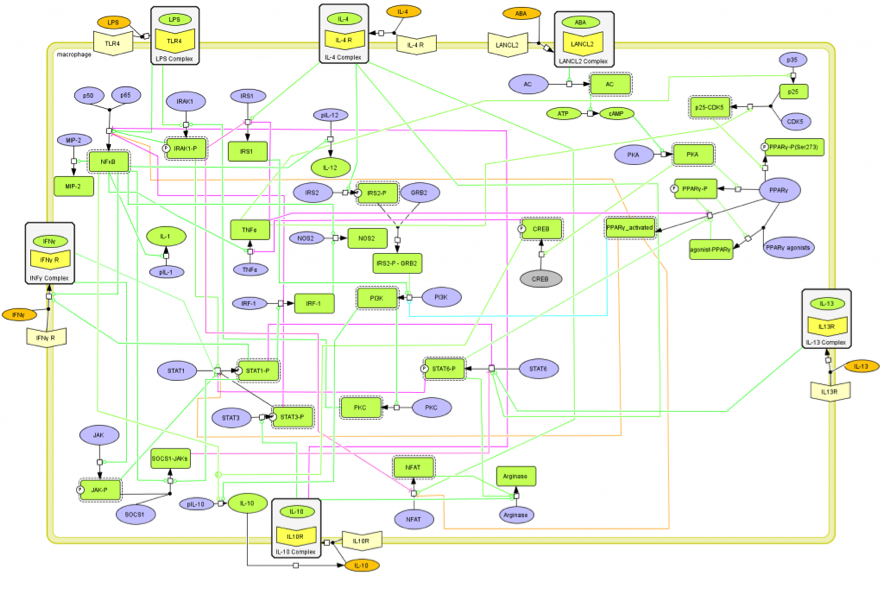 Figure 2. CellDesigner-based illustration of the COPASI model representing the M1/M2 phenotype polarization network.
Highlights
- Applying data-driven modeling approaches to modify existing macrophage models
- Characterizing the regulatory mechanisms of macrophage polarization initialized by LANCL2
- Developing multi-scale models that incorporating ODE-based models of macrophage polarization
Ongoing Efforts
Functional polarization of macrophages into M1 or M2 cells is a well-known property of macrophages. Based on the surrounding stimuli and secreted immune molecule profiles, macrophages can be divided into at least two functional subsets including inflammatory M1 and regulatory M2. Microbial products lipopolysaccharide (LPS), interferon-γ (IFN-γ), granulocyte-macrophage colony-stimulating factor (GM-CSF) and tumor necrosis factor (TNF) elicit classically activated macrophage M1 mediating intracellular microorganism killing, tissue destruction and tumor resistance. M1 macrophages are generally characterized by secreting pro-inflammatory molecules TNF-α, IL-1, IL-12, reactive oxygen intermediates (ROI), and reactive nitrogen intermediate (RNI). Mirroring the Th1 and Th2 nomenclature, M2 or alternatively activated macrophages are another macrophage phenotype with regulatory and reparative functions. M2 can be polarized by exposure to macrophage-colony-stimulating factor (M-CSF), IL-4, IL-10 or IL-13 and characterized by expressing IL-10, arginase-1 mannose and galactose-type receptors. As opposed to the inflammatory function of M1, M2 play roles in immune homeostasis and regulation before and after inflammation with compromised immune response, debris clearing, tissue repair and angiogenesis. Interestingly, tumor associated macrophages and myeloid immature suppressors also exhibit M2 polarization with dampened immune response, promotion of tumor angiogenesis and metastasis.
Macrophage Model
Although molecular mechanisms of macrophage polarization have been investigated experimentally, molecular determinants of macrophage diversity are to a large extent unknown (Figure 1).
To gain a more comprehensive mechanistic understanding of M1/M2 paradigm, we have developed models that mimic the dynamic behavior of the intracellular signaling pathways controlling M1/M2 phenotype polarization. This model sheds a light on the prediction of macrophage status and function in enteric infection and related therapeutic application.
The following is a model update note on July 2nd, 2012 from the Macrophage modeling team: since last release on April 28th, 2012, the model structure has been stabilized. We have been focusing on expanding the calibration database using experimental data from published references and performing parameter estimations for total 138 parameters.
The following is a list of Macrophage computational model releases. Please click on individual releases for more details.
- Third, the latest, release on April 28th, 2012
- Second release on Jan 11th, 2011
- First release on Oct 7th, 2011
The primary MIEP Team member responsible for maintaining this model is Pinyi Lu at the Virginia Bioinformatics Institute. Please contact him with any questions or comments.
For the latest release, the model is available for download in CellDesigner xml format. We have tested that the model is compatible with Cell Designer 4.1. The following is the structure figure of the model, and by clicking on the figure you can navigate the model through a Google-Map-API-enabled CellPublisher user friendly interface (Figure 2).
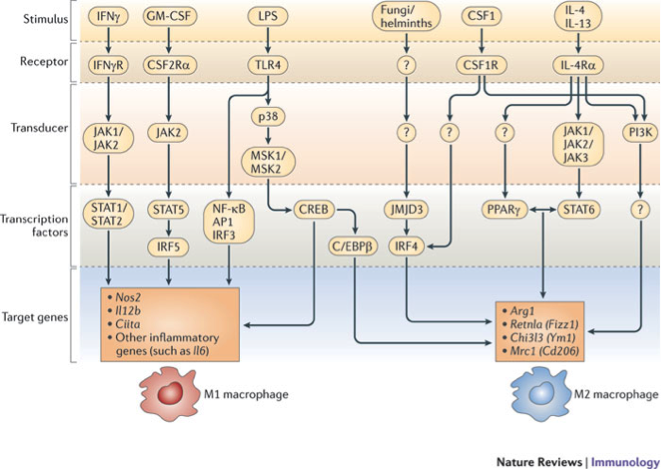 Figure 1. Signal transduction pathways to M1 and M2 macrophage polarization (Lawrence T, Natoli G (2011) Nat Rev Immunol 11: 750-761.)
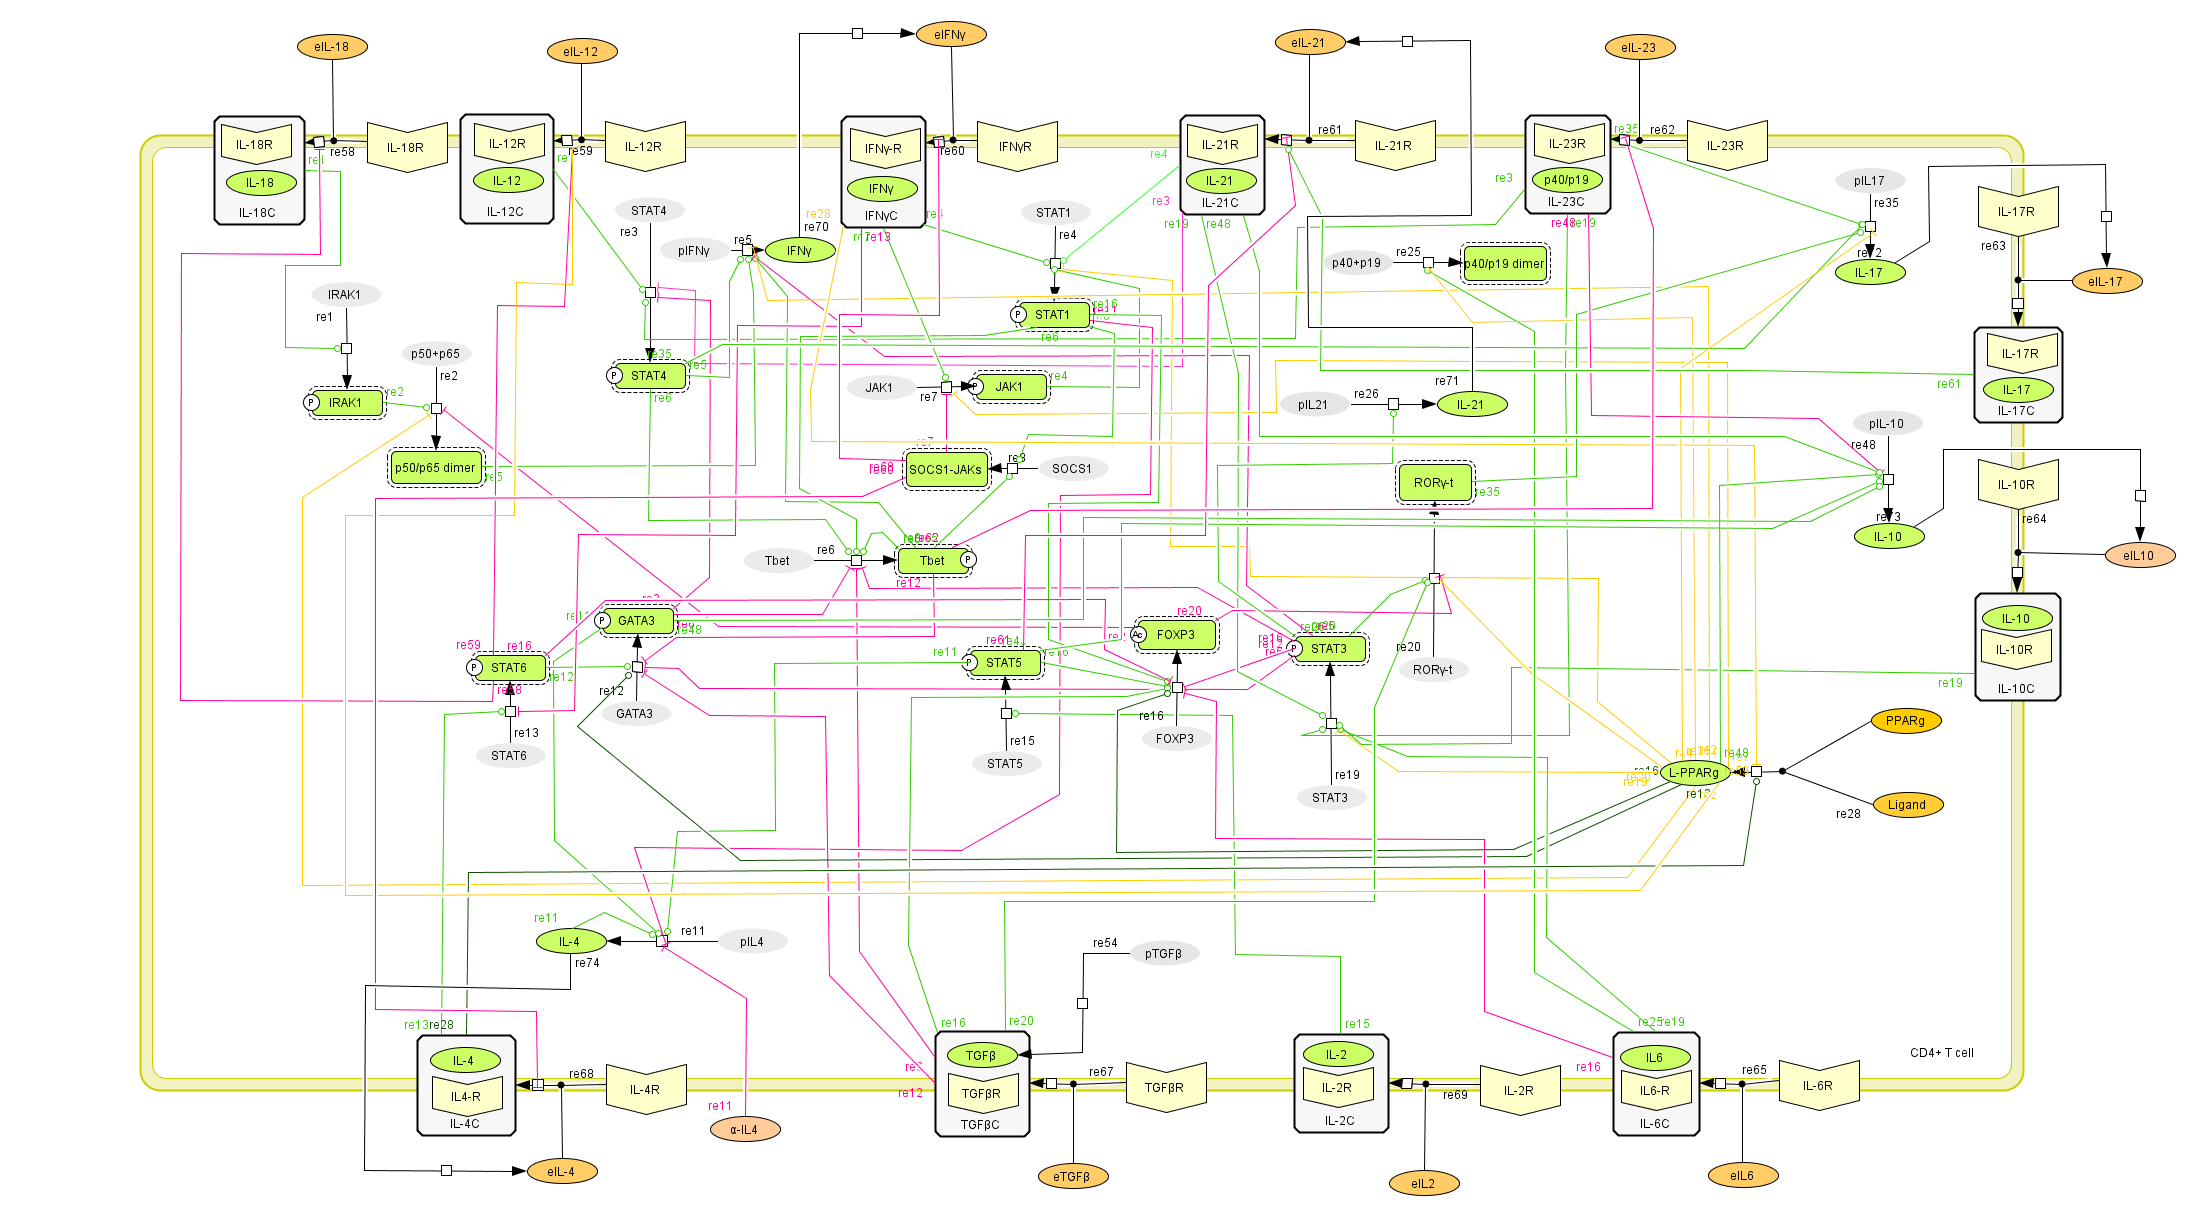
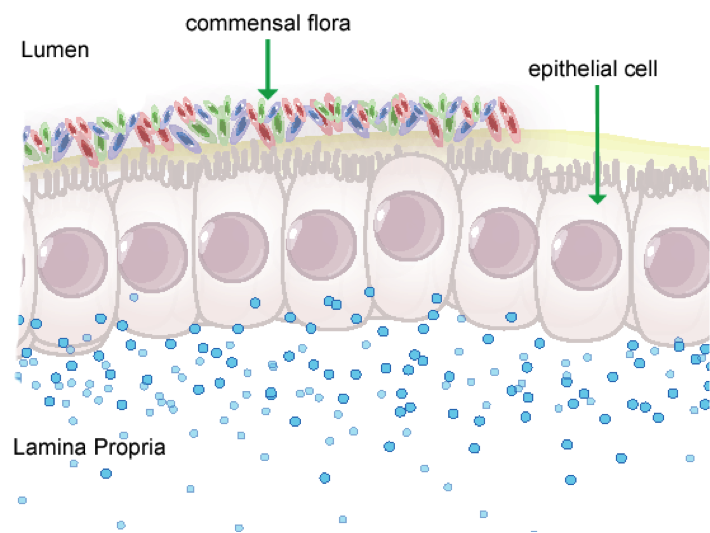
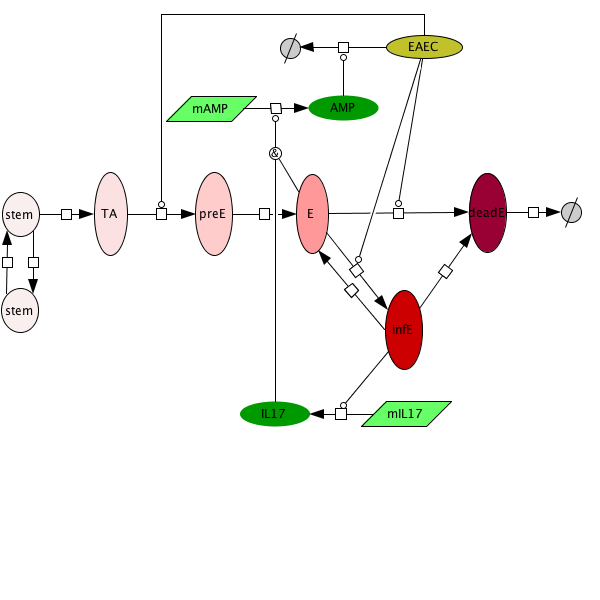